Immigrants from Ukraine vs Ecuadorian College, 1 year or more
COMPARE
Immigrants from Ukraine
Ecuadorian
College, 1 year or more
College, 1 year or more Comparison
Immigrants from Ukraine
Ecuadorians
61.9%
COLLEGE, 1 YEAR OR MORE
95.8/ 100
METRIC RATING
107th/ 347
METRIC RANK
54.3%
COLLEGE, 1 YEAR OR MORE
0.2/ 100
METRIC RATING
277th/ 347
METRIC RANK
Immigrants from Ukraine vs Ecuadorian College, 1 year or more Correlation Chart
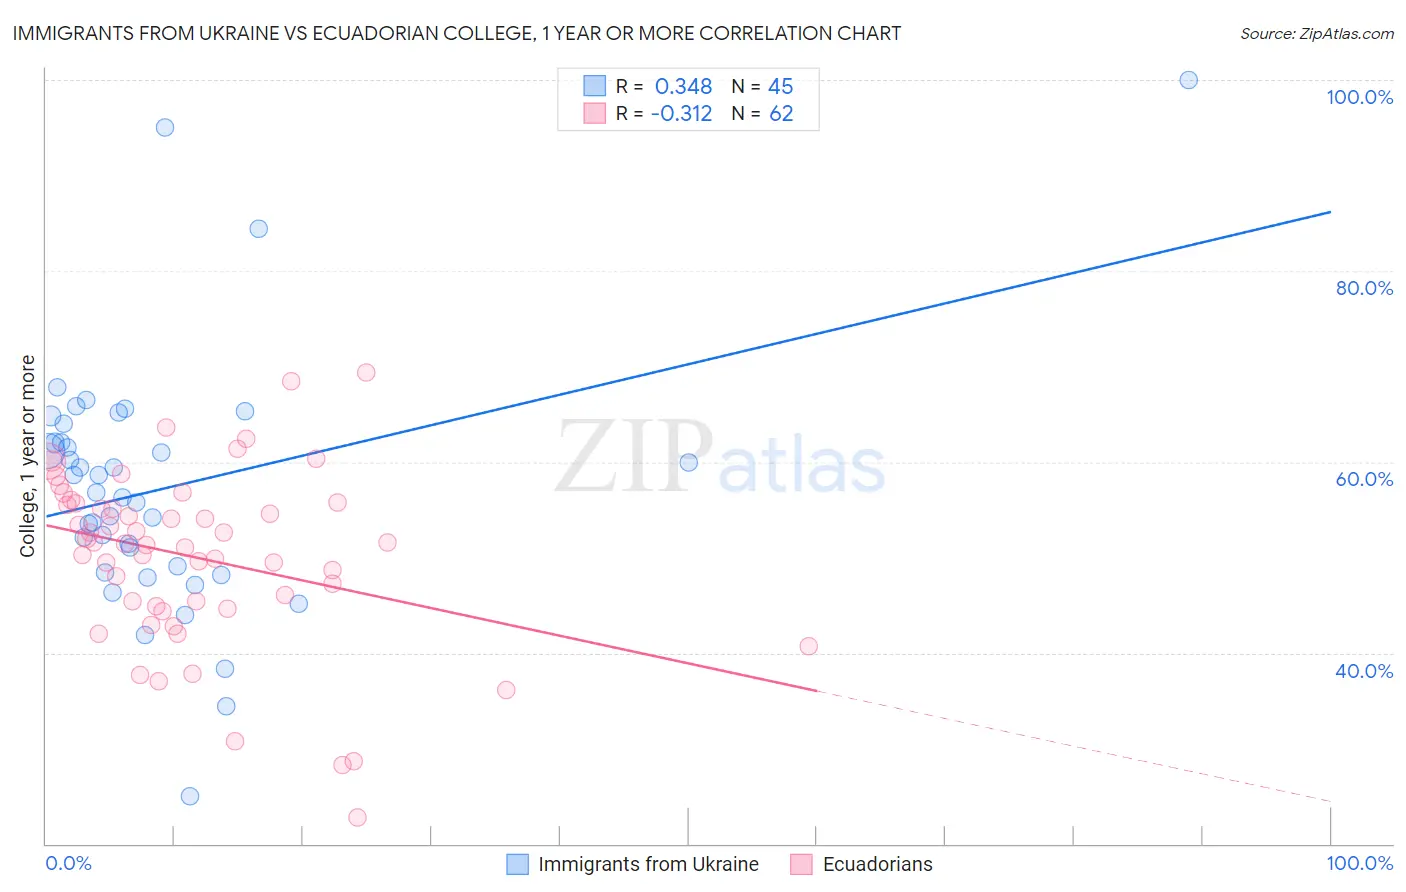
The statistical analysis conducted on geographies consisting of 289,712,941 people shows a mild positive correlation between the proportion of Immigrants from Ukraine and percentage of population with at least college, 1 year or more education in the United States with a correlation coefficient (R) of 0.348 and weighted average of 61.9%. Similarly, the statistical analysis conducted on geographies consisting of 317,865,755 people shows a mild negative correlation between the proportion of Ecuadorians and percentage of population with at least college, 1 year or more education in the United States with a correlation coefficient (R) of -0.312 and weighted average of 54.3%, a difference of 13.9%.
College, 1 year or more Correlation Summary
| Measurement | Immigrants from Ukraine | Ecuadorian |
| Minimum | 25.0% | 22.7% |
| Maximum | 100.0% | 69.4% |
| Range | 75.0% | 46.6% |
| Mean | 57.2% | 50.0% |
| Median | 56.8% | 51.5% |
| Interquartile 25% (IQ1) | 48.8% | 44.9% |
| Interquartile 75% (IQ3) | 63.0% | 55.7% |
| Interquartile Range (IQR) | 14.2% | 10.7% |
| Standard Deviation (Sample) | 13.4% | 9.3% |
| Standard Deviation (Population) | 13.2% | 9.2% |
Similar Demographics by College, 1 year or more
Demographics Similar to Immigrants from Ukraine by College, 1 year or more
In terms of college, 1 year or more, the demographic groups most similar to Immigrants from Ukraine are Syrian (61.9%, a difference of 0.020%), Immigrants from Northern Africa (61.9%, a difference of 0.020%), European (61.8%, a difference of 0.040%), Macedonian (61.8%, a difference of 0.040%), and Austrian (61.8%, a difference of 0.10%).
| Demographics | Rating | Rank | College, 1 year or more |
| Icelanders | 96.8 /100 | #100 | Exceptional 62.1% |
| Swedes | 96.8 /100 | #101 | Exceptional 62.1% |
| Luxembourgers | 96.7 /100 | #102 | Exceptional 62.1% |
| Afghans | 96.4 /100 | #103 | Exceptional 62.0% |
| Chileans | 96.4 /100 | #104 | Exceptional 62.0% |
| Immigrants | Nepal | 96.3 /100 | #105 | Exceptional 62.0% |
| Palestinians | 96.3 /100 | #106 | Exceptional 62.0% |
| Immigrants | Ukraine | 95.8 /100 | #107 | Exceptional 61.9% |
| Syrians | 95.7 /100 | #108 | Exceptional 61.9% |
| Immigrants | Northern Africa | 95.7 /100 | #109 | Exceptional 61.9% |
| Europeans | 95.6 /100 | #110 | Exceptional 61.8% |
| Macedonians | 95.6 /100 | #111 | Exceptional 61.8% |
| Austrians | 95.4 /100 | #112 | Exceptional 61.8% |
| Ukrainians | 95.2 /100 | #113 | Exceptional 61.8% |
| Danes | 94.8 /100 | #114 | Exceptional 61.7% |
Demographics Similar to Ecuadorians by College, 1 year or more
In terms of college, 1 year or more, the demographic groups most similar to Ecuadorians are Shoshone (54.3%, a difference of 0.040%), American (54.4%, a difference of 0.12%), Belizean (54.4%, a difference of 0.15%), Immigrants from Grenada (54.4%, a difference of 0.19%), and Comanche (54.4%, a difference of 0.22%).
| Demographics | Rating | Rank | College, 1 year or more |
| Crow | 0.2 /100 | #270 | Tragic 54.5% |
| Bahamians | 0.2 /100 | #271 | Tragic 54.5% |
| Comanche | 0.2 /100 | #272 | Tragic 54.4% |
| Immigrants | Grenada | 0.2 /100 | #273 | Tragic 54.4% |
| Belizeans | 0.2 /100 | #274 | Tragic 54.4% |
| Americans | 0.2 /100 | #275 | Tragic 54.4% |
| Shoshone | 0.2 /100 | #276 | Tragic 54.3% |
| Ecuadorians | 0.2 /100 | #277 | Tragic 54.3% |
| Immigrants | Jamaica | 0.1 /100 | #278 | Tragic 54.2% |
| Arapaho | 0.1 /100 | #279 | Tragic 54.1% |
| Cheyenne | 0.1 /100 | #280 | Tragic 54.1% |
| Colville | 0.1 /100 | #281 | Tragic 54.1% |
| Guyanese | 0.1 /100 | #282 | Tragic 54.1% |
| Nicaraguans | 0.1 /100 | #283 | Tragic 53.9% |
| Ute | 0.1 /100 | #284 | Tragic 53.8% |