Immigrants from South America vs Shoshone GED/Equivalency
COMPARE
Immigrants from South America
Shoshone
GED/Equivalency
GED/Equivalency Comparison
Immigrants from South America
Shoshone
84.4%
GED/EQUIVALENCY
4.2/ 100
METRIC RATING
232nd/ 347
METRIC RANK
83.7%
GED/EQUIVALENCY
1.0/ 100
METRIC RATING
250th/ 347
METRIC RANK
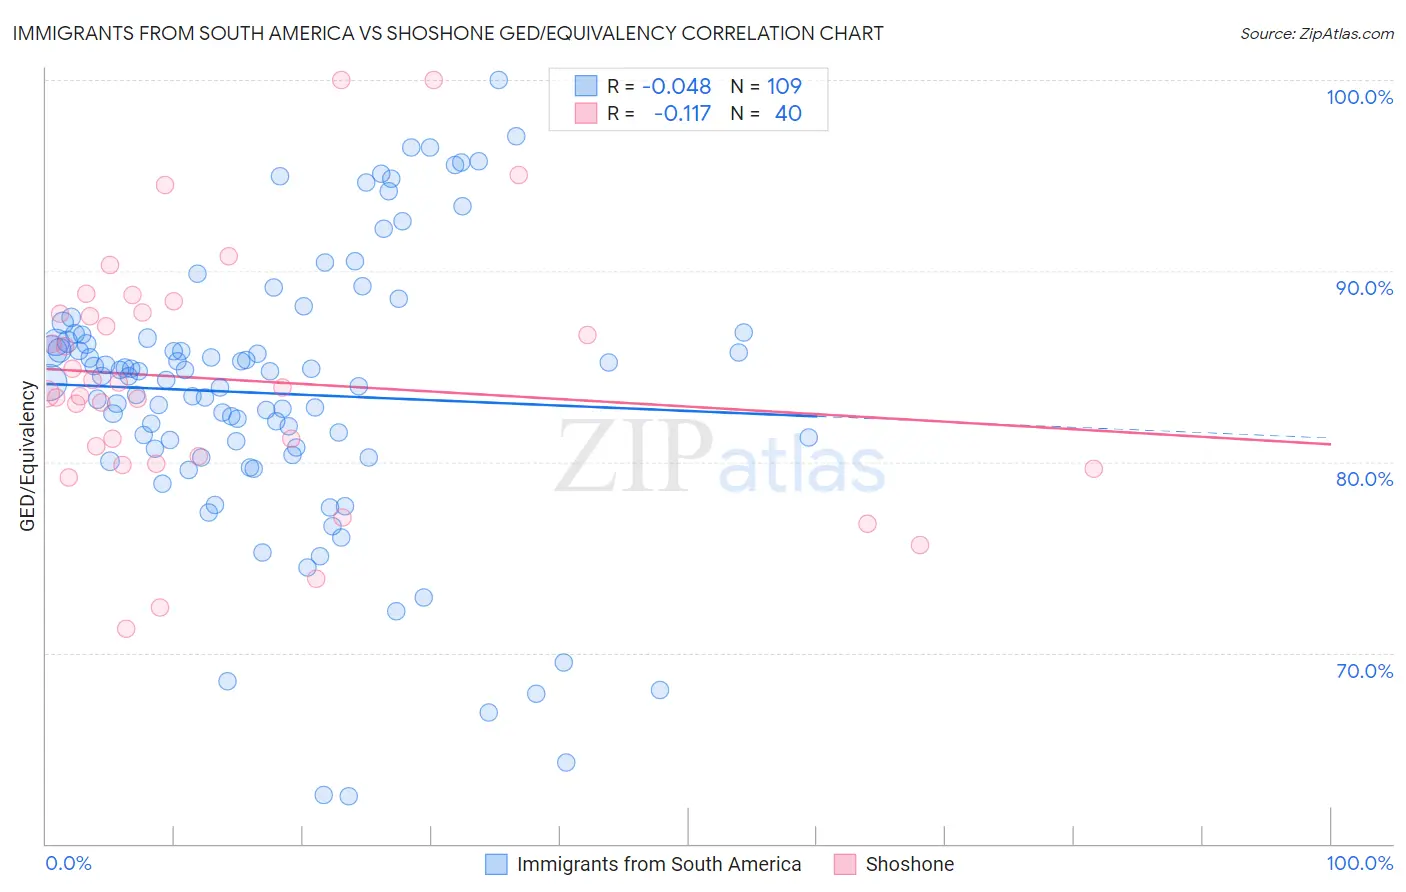
Immigrants from South America vs Shoshone GED/Equivalency Correlation Chart
The statistical analysis conducted on geographies consisting of 486,429,793 people shows no correlation between the proportion of Immigrants from South America and percentage of population with at least ged/equivalency education in the United States with a correlation coefficient (R) of -0.048 and weighted average of 84.4%. Similarly, the statistical analysis conducted on geographies consisting of 66,627,351 people shows a poor negative correlation between the proportion of Shoshone and percentage of population with at least ged/equivalency education in the United States with a correlation coefficient (R) of -0.117 and weighted average of 83.7%, a difference of 0.75%.
GED/Equivalency Correlation Summary
| Measurement | Immigrants from South America | Shoshone |
| Minimum | 62.5% | 71.3% |
| Maximum | 100.0% | 100.0% |
| Range | 37.5% | 28.7% |
| Mean | 83.6% | 84.3% |
| Median | 84.5% | 83.7% |
| Interquartile 25% (IQ1) | 80.5% | 80.1% |
| Interquartile 75% (IQ3) | 86.6% | 87.8% |
| Interquartile Range (IQR) | 6.0% | 7.7% |
| Standard Deviation (Sample) | 7.4% | 6.5% |
| Standard Deviation (Population) | 7.3% | 6.4% |
Demographics Similar to Immigrants from South America and Shoshone by GED/Equivalency
In terms of ged/equivalency, the demographic groups most similar to Immigrants from South America are Immigrants from Panama (84.4%, a difference of 0.010%), Immigrants from Middle Africa (84.4%, a difference of 0.020%), Immigrants from Nigeria (84.3%, a difference of 0.080%), Ghanaian (84.3%, a difference of 0.10%), and Immigrants from Eritrea (84.3%, a difference of 0.10%). Similarly, the demographic groups most similar to Shoshone are Blackfeet (83.8%, a difference of 0.020%), Crow (83.8%, a difference of 0.020%), Immigrants from Western Africa (83.8%, a difference of 0.040%), Chickasaw (83.8%, a difference of 0.070%), and Immigrants from Senegal (83.8%, a difference of 0.090%).
| Demographics | Rating | Rank | GED/Equivalency |
| Immigrants | Middle Africa | 4.3 /100 | #231 | Tragic 84.4% |
| Immigrants | South America | 4.2 /100 | #232 | Tragic 84.4% |
| Immigrants | Panama | 4.1 /100 | #233 | Tragic 84.4% |
| Immigrants | Nigeria | 3.6 /100 | #234 | Tragic 84.3% |
| Ghanaians | 3.5 /100 | #235 | Tragic 84.3% |
| Immigrants | Eritrea | 3.5 /100 | #236 | Tragic 84.3% |
| Sub-Saharan Africans | 3.0 /100 | #237 | Tragic 84.2% |
| Immigrants | Peru | 2.7 /100 | #238 | Tragic 84.2% |
| Immigrants | Bahamas | 2.6 /100 | #239 | Tragic 84.2% |
| Immigrants | South Eastern Asia | 2.5 /100 | #240 | Tragic 84.1% |
| Senegalese | 1.9 /100 | #241 | Tragic 84.0% |
| Sri Lankans | 1.9 /100 | #242 | Tragic 84.0% |
| Cherokee | 1.3 /100 | #243 | Tragic 83.9% |
| Immigrants | Ghana | 1.3 /100 | #244 | Tragic 83.9% |
| Immigrants | Senegal | 1.2 /100 | #245 | Tragic 83.8% |
| Chickasaw | 1.2 /100 | #246 | Tragic 83.8% |
| Immigrants | Western Africa | 1.1 /100 | #247 | Tragic 83.8% |
| Blackfeet | 1.1 /100 | #248 | Tragic 83.8% |
| Crow | 1.1 /100 | #249 | Tragic 83.8% |
| Shoshone | 1.0 /100 | #250 | Tragic 83.7% |
| Spanish Americans | 0.8 /100 | #251 | Tragic 83.6% |