Immigrants from South America vs Immigrants from Nicaragua GED/Equivalency
COMPARE
Immigrants from South America
Immigrants from Nicaragua
GED/Equivalency
GED/Equivalency Comparison
Immigrants from South America
Immigrants from Nicaragua
84.4%
GED/EQUIVALENCY
4.2/ 100
METRIC RATING
232nd/ 347
METRIC RANK
79.9%
GED/EQUIVALENCY
0.0/ 100
METRIC RATING
323rd/ 347
METRIC RANK
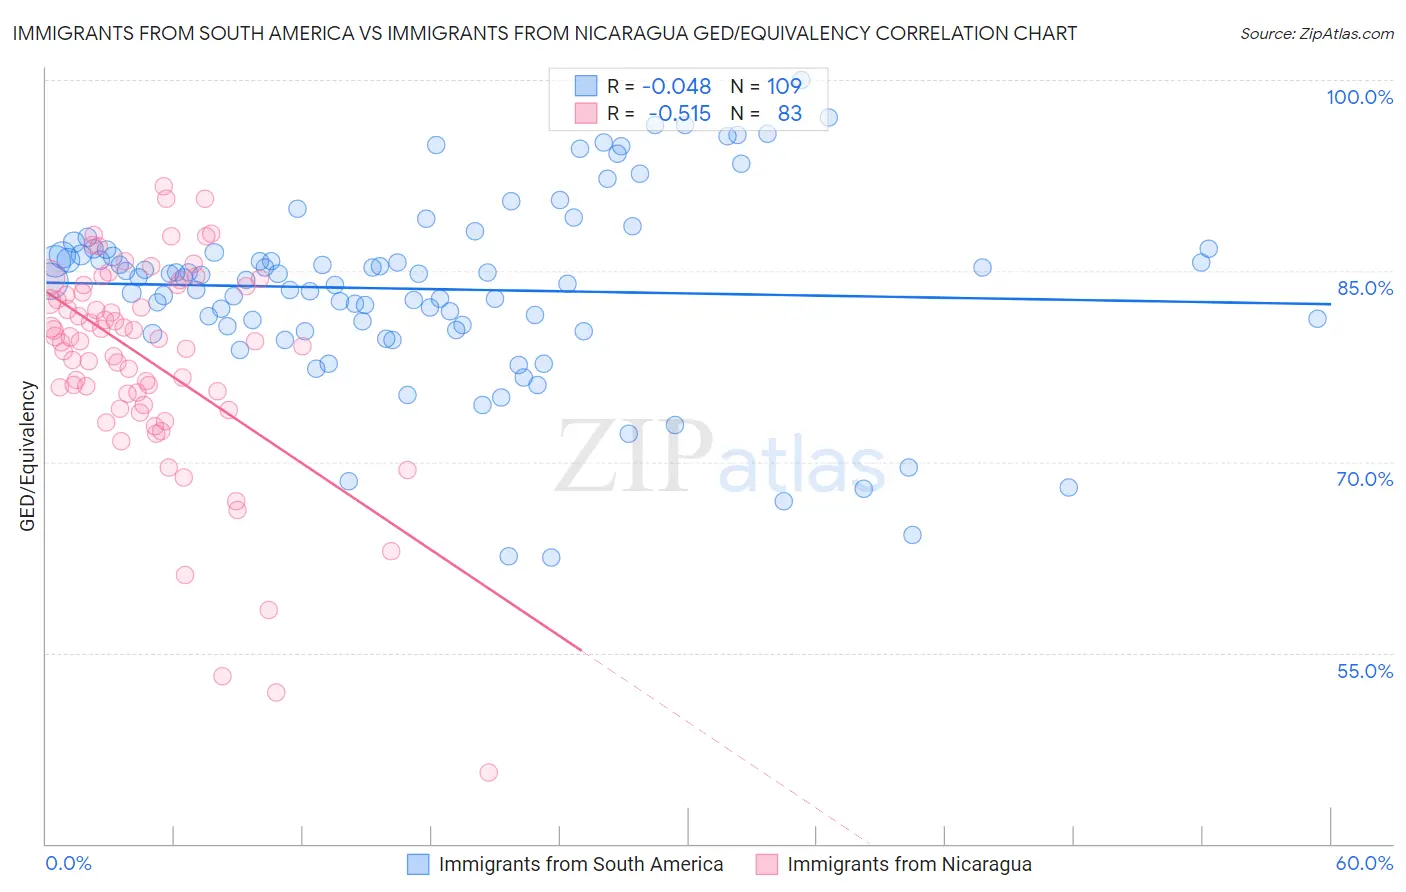
Immigrants from South America vs Immigrants from Nicaragua GED/Equivalency Correlation Chart
The statistical analysis conducted on geographies consisting of 486,429,793 people shows no correlation between the proportion of Immigrants from South America and percentage of population with at least ged/equivalency education in the United States with a correlation coefficient (R) of -0.048 and weighted average of 84.4%. Similarly, the statistical analysis conducted on geographies consisting of 236,340,156 people shows a substantial negative correlation between the proportion of Immigrants from Nicaragua and percentage of population with at least ged/equivalency education in the United States with a correlation coefficient (R) of -0.515 and weighted average of 79.9%, a difference of 5.6%.
GED/Equivalency Correlation Summary
| Measurement | Immigrants from South America | Immigrants from Nicaragua |
| Minimum | 62.5% | 45.6% |
| Maximum | 100.0% | 91.7% |
| Range | 37.5% | 46.1% |
| Mean | 83.6% | 77.9% |
| Median | 84.5% | 79.5% |
| Interquartile 25% (IQ1) | 80.5% | 74.4% |
| Interquartile 75% (IQ3) | 86.6% | 83.8% |
| Interquartile Range (IQR) | 6.0% | 9.3% |
| Standard Deviation (Sample) | 7.4% | 8.4% |
| Standard Deviation (Population) | 7.3% | 8.4% |
Similar Demographics by GED/Equivalency
Demographics Similar to Immigrants from South America by GED/Equivalency
In terms of ged/equivalency, the demographic groups most similar to Immigrants from South America are Immigrants from Panama (84.4%, a difference of 0.010%), Immigrants from Middle Africa (84.4%, a difference of 0.020%), Immigrants from Colombia (84.4%, a difference of 0.040%), Immigrants from Uruguay (84.4%, a difference of 0.050%), and Immigrants from Nigeria (84.3%, a difference of 0.080%).
| Demographics | Rating | Rank | GED/Equivalency |
| Immigrants | Thailand | 5.8 /100 | #225 | Tragic 84.5% |
| Immigrants | Zaire | 5.5 /100 | #226 | Tragic 84.5% |
| Immigrants | Costa Rica | 5.4 /100 | #227 | Tragic 84.5% |
| Immigrants | Liberia | 4.9 /100 | #228 | Tragic 84.4% |
| Immigrants | Uruguay | 4.6 /100 | #229 | Tragic 84.4% |
| Immigrants | Colombia | 4.5 /100 | #230 | Tragic 84.4% |
| Immigrants | Middle Africa | 4.3 /100 | #231 | Tragic 84.4% |
| Immigrants | South America | 4.2 /100 | #232 | Tragic 84.4% |
| Immigrants | Panama | 4.1 /100 | #233 | Tragic 84.4% |
| Immigrants | Nigeria | 3.6 /100 | #234 | Tragic 84.3% |
| Ghanaians | 3.5 /100 | #235 | Tragic 84.3% |
| Immigrants | Eritrea | 3.5 /100 | #236 | Tragic 84.3% |
| Sub-Saharan Africans | 3.0 /100 | #237 | Tragic 84.2% |
| Immigrants | Peru | 2.7 /100 | #238 | Tragic 84.2% |
| Immigrants | Bahamas | 2.6 /100 | #239 | Tragic 84.2% |
Demographics Similar to Immigrants from Nicaragua by GED/Equivalency
In terms of ged/equivalency, the demographic groups most similar to Immigrants from Nicaragua are Lumbee (80.0%, a difference of 0.12%), Yup'ik (80.0%, a difference of 0.19%), Immigrants from Cuba (80.2%, a difference of 0.36%), Mexican American Indian (79.4%, a difference of 0.65%), and Honduran (79.3%, a difference of 0.76%).
| Demographics | Rating | Rank | GED/Equivalency |
| Central American Indians | 0.0 /100 | #316 | Tragic 80.6% |
| Immigrants | Caribbean | 0.0 /100 | #317 | Tragic 80.5% |
| Yaqui | 0.0 /100 | #318 | Tragic 80.5% |
| Immigrants | Belize | 0.0 /100 | #319 | Tragic 80.5% |
| Immigrants | Cuba | 0.0 /100 | #320 | Tragic 80.2% |
| Yup'ik | 0.0 /100 | #321 | Tragic 80.0% |
| Lumbee | 0.0 /100 | #322 | Tragic 80.0% |
| Immigrants | Nicaragua | 0.0 /100 | #323 | Tragic 79.9% |
| Mexican American Indians | 0.0 /100 | #324 | Tragic 79.4% |
| Hondurans | 0.0 /100 | #325 | Tragic 79.3% |
| Yuman | 0.0 /100 | #326 | Tragic 79.2% |
| Central Americans | 0.0 /100 | #327 | Tragic 79.2% |
| Hispanics or Latinos | 0.0 /100 | #328 | Tragic 79.1% |
| Dominicans | 0.0 /100 | #329 | Tragic 79.1% |
| Immigrants | Cabo Verde | 0.0 /100 | #330 | Tragic 78.9% |