Immigrants from South Africa vs Immigrants from Western Asia GED/Equivalency
COMPARE
Immigrants from South Africa
Immigrants from Western Asia
GED/Equivalency
GED/Equivalency Comparison
Immigrants from South Africa
Immigrants from Western Asia
88.0%
GED/EQUIVALENCY
99.4/ 100
METRIC RATING
53rd/ 347
METRIC RANK
86.3%
GED/EQUIVALENCY
78.8/ 100
METRIC RATING
150th/ 347
METRIC RANK
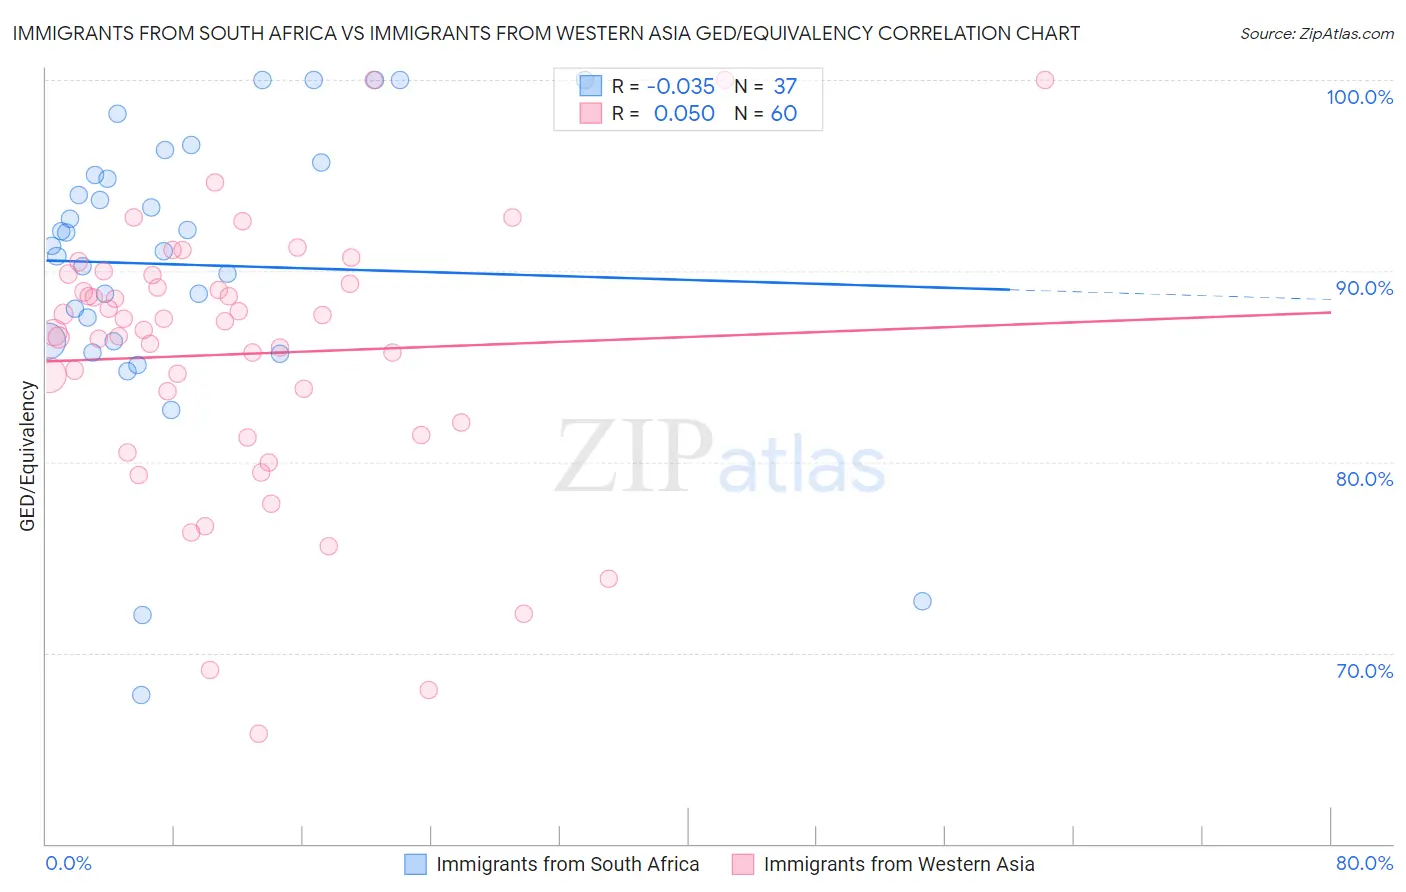
Immigrants from South Africa vs Immigrants from Western Asia GED/Equivalency Correlation Chart
The statistical analysis conducted on geographies consisting of 233,321,845 people shows no correlation between the proportion of Immigrants from South Africa and percentage of population with at least ged/equivalency education in the United States with a correlation coefficient (R) of -0.035 and weighted average of 88.0%. Similarly, the statistical analysis conducted on geographies consisting of 404,408,465 people shows no correlation between the proportion of Immigrants from Western Asia and percentage of population with at least ged/equivalency education in the United States with a correlation coefficient (R) of 0.050 and weighted average of 86.3%, a difference of 1.9%.
GED/Equivalency Correlation Summary
| Measurement | Immigrants from South Africa | Immigrants from Western Asia |
| Minimum | 67.8% | 65.8% |
| Maximum | 100.0% | 100.0% |
| Range | 32.2% | 34.2% |
| Mean | 90.3% | 85.7% |
| Median | 91.3% | 87.1% |
| Interquartile 25% (IQ1) | 86.3% | 81.7% |
| Interquartile 75% (IQ3) | 95.4% | 89.6% |
| Interquartile Range (IQR) | 9.0% | 7.8% |
| Standard Deviation (Sample) | 7.6% | 7.1% |
| Standard Deviation (Population) | 7.5% | 7.1% |
Similar Demographics by GED/Equivalency
Demographics Similar to Immigrants from South Africa by GED/Equivalency
In terms of ged/equivalency, the demographic groups most similar to Immigrants from South Africa are Immigrants from Netherlands (88.0%, a difference of 0.0%), Zimbabwean (88.0%, a difference of 0.0%), Soviet Union (88.0%, a difference of 0.010%), New Zealander (88.0%, a difference of 0.010%), and Immigrants from Denmark (88.0%, a difference of 0.030%).
| Demographics | Rating | Rank | GED/Equivalency |
| Immigrants | Switzerland | 99.5 /100 | #46 | Exceptional 88.1% |
| Immigrants | Latvia | 99.5 /100 | #47 | Exceptional 88.1% |
| Greeks | 99.5 /100 | #48 | Exceptional 88.1% |
| Australians | 99.5 /100 | #49 | Exceptional 88.1% |
| Immigrants | Korea | 99.5 /100 | #50 | Exceptional 88.1% |
| Immigrants | Netherlands | 99.4 /100 | #51 | Exceptional 88.0% |
| Zimbabweans | 99.4 /100 | #52 | Exceptional 88.0% |
| Immigrants | South Africa | 99.4 /100 | #53 | Exceptional 88.0% |
| Soviet Union | 99.4 /100 | #54 | Exceptional 88.0% |
| New Zealanders | 99.4 /100 | #55 | Exceptional 88.0% |
| Immigrants | Denmark | 99.4 /100 | #56 | Exceptional 88.0% |
| Immigrants | Czechoslovakia | 99.3 /100 | #57 | Exceptional 87.9% |
| Northern Europeans | 99.3 /100 | #58 | Exceptional 87.9% |
| Serbians | 99.3 /100 | #59 | Exceptional 87.9% |
| Scandinavians | 99.3 /100 | #60 | Exceptional 87.9% |
Demographics Similar to Immigrants from Western Asia by GED/Equivalency
In terms of ged/equivalency, the demographic groups most similar to Immigrants from Western Asia are Menominee (86.3%, a difference of 0.010%), Basque (86.4%, a difference of 0.020%), Immigrants from Northern Africa (86.3%, a difference of 0.020%), Immigrants from Poland (86.3%, a difference of 0.020%), and Immigrants from Bosnia and Herzegovina (86.3%, a difference of 0.030%).
| Demographics | Rating | Rank | GED/Equivalency |
| Immigrants | Pakistan | 82.4 /100 | #143 | Excellent 86.4% |
| Bolivians | 82.1 /100 | #144 | Excellent 86.4% |
| Pakistanis | 80.4 /100 | #145 | Excellent 86.4% |
| Basques | 79.5 /100 | #146 | Good 86.4% |
| Immigrants | Northern Africa | 79.3 /100 | #147 | Good 86.3% |
| Immigrants | Poland | 79.3 /100 | #148 | Good 86.3% |
| Menominee | 79.3 /100 | #149 | Good 86.3% |
| Immigrants | Western Asia | 78.8 /100 | #150 | Good 86.3% |
| Immigrants | Bosnia and Herzegovina | 77.9 /100 | #151 | Good 86.3% |
| Brazilians | 77.2 /100 | #152 | Good 86.3% |
| Kenyans | 76.6 /100 | #153 | Good 86.3% |
| Armenians | 76.4 /100 | #154 | Good 86.3% |
| Iraqis | 75.2 /100 | #155 | Good 86.2% |
| Immigrants | Nepal | 73.3 /100 | #156 | Good 86.2% |
| Whites/Caucasians | 72.2 /100 | #157 | Good 86.2% |