Immigrants from South Africa vs Italian GED/Equivalency
COMPARE
Immigrants from South Africa
Italian
GED/Equivalency
GED/Equivalency Comparison
Immigrants from South Africa
Italians
88.0%
GED/EQUIVALENCY
99.4/ 100
METRIC RATING
53rd/ 347
METRIC RANK
88.2%
GED/EQUIVALENCY
99.6/ 100
METRIC RATING
40th/ 347
METRIC RANK
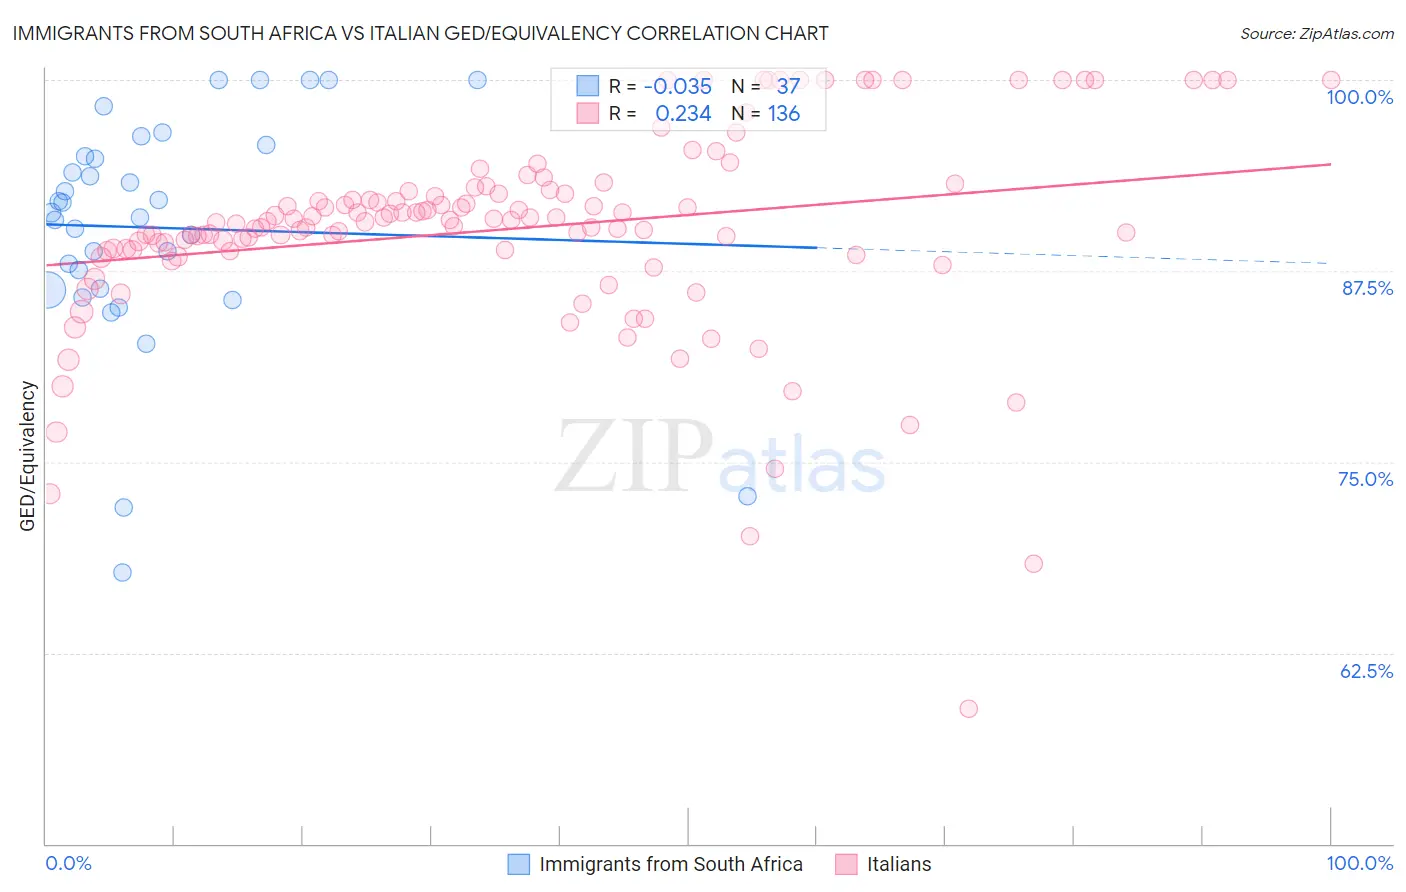
Immigrants from South Africa vs Italian GED/Equivalency Correlation Chart
The statistical analysis conducted on geographies consisting of 233,321,845 people shows no correlation between the proportion of Immigrants from South Africa and percentage of population with at least ged/equivalency education in the United States with a correlation coefficient (R) of -0.035 and weighted average of 88.0%. Similarly, the statistical analysis conducted on geographies consisting of 575,117,227 people shows a weak positive correlation between the proportion of Italians and percentage of population with at least ged/equivalency education in the United States with a correlation coefficient (R) of 0.234 and weighted average of 88.2%, a difference of 0.22%.
GED/Equivalency Correlation Summary
| Measurement | Immigrants from South Africa | Italian |
| Minimum | 67.8% | 58.8% |
| Maximum | 100.0% | 100.0% |
| Range | 32.2% | 41.2% |
| Mean | 90.3% | 90.2% |
| Median | 91.3% | 90.7% |
| Interquartile 25% (IQ1) | 86.3% | 88.8% |
| Interquartile 75% (IQ3) | 95.4% | 92.6% |
| Interquartile Range (IQR) | 9.0% | 3.8% |
| Standard Deviation (Sample) | 7.6% | 6.6% |
| Standard Deviation (Population) | 7.5% | 6.5% |
Demographics Similar to Immigrants from South Africa and Italians by GED/Equivalency
In terms of ged/equivalency, the demographic groups most similar to Immigrants from South Africa are Immigrants from Netherlands (88.0%, a difference of 0.0%), Zimbabwean (88.0%, a difference of 0.0%), Soviet Union (88.0%, a difference of 0.010%), New Zealander (88.0%, a difference of 0.010%), and Immigrants from Denmark (88.0%, a difference of 0.030%). Similarly, the demographic groups most similar to Italians are Finnish (88.2%, a difference of 0.010%), Immigrants from Israel (88.2%, a difference of 0.020%), Cambodian (88.2%, a difference of 0.040%), Immigrants from Scotland (88.2%, a difference of 0.050%), and Macedonian (88.1%, a difference of 0.080%).
| Demographics | Rating | Rank | GED/Equivalency |
| Immigrants | Belgium | 99.7 /100 | #36 | Exceptional 88.3% |
| Immigrants | Austria | 99.7 /100 | #37 | Exceptional 88.3% |
| Burmese | 99.7 /100 | #38 | Exceptional 88.3% |
| Immigrants | Israel | 99.6 /100 | #39 | Exceptional 88.2% |
| Italians | 99.6 /100 | #40 | Exceptional 88.2% |
| Finns | 99.6 /100 | #41 | Exceptional 88.2% |
| Cambodians | 99.6 /100 | #42 | Exceptional 88.2% |
| Immigrants | Scotland | 99.6 /100 | #43 | Exceptional 88.2% |
| Macedonians | 99.5 /100 | #44 | Exceptional 88.1% |
| Czechs | 99.5 /100 | #45 | Exceptional 88.1% |
| Immigrants | Switzerland | 99.5 /100 | #46 | Exceptional 88.1% |
| Immigrants | Latvia | 99.5 /100 | #47 | Exceptional 88.1% |
| Greeks | 99.5 /100 | #48 | Exceptional 88.1% |
| Australians | 99.5 /100 | #49 | Exceptional 88.1% |
| Immigrants | Korea | 99.5 /100 | #50 | Exceptional 88.1% |
| Immigrants | Netherlands | 99.4 /100 | #51 | Exceptional 88.0% |
| Zimbabweans | 99.4 /100 | #52 | Exceptional 88.0% |
| Immigrants | South Africa | 99.4 /100 | #53 | Exceptional 88.0% |
| Soviet Union | 99.4 /100 | #54 | Exceptional 88.0% |
| New Zealanders | 99.4 /100 | #55 | Exceptional 88.0% |
| Immigrants | Denmark | 99.4 /100 | #56 | Exceptional 88.0% |