Immigrants from France vs Immigrants from Fiji College, Under 1 year
COMPARE
Immigrants from France
Immigrants from Fiji
College, Under 1 year
College, Under 1 year Comparison
Immigrants from France
Immigrants from Fiji
71.0%
COLLEGE, UNDER 1 YEAR
100.0/ 100
METRIC RATING
29th/ 347
METRIC RANK
63.4%
COLLEGE, UNDER 1 YEAR
5.7/ 100
METRIC RATING
219th/ 347
METRIC RANK
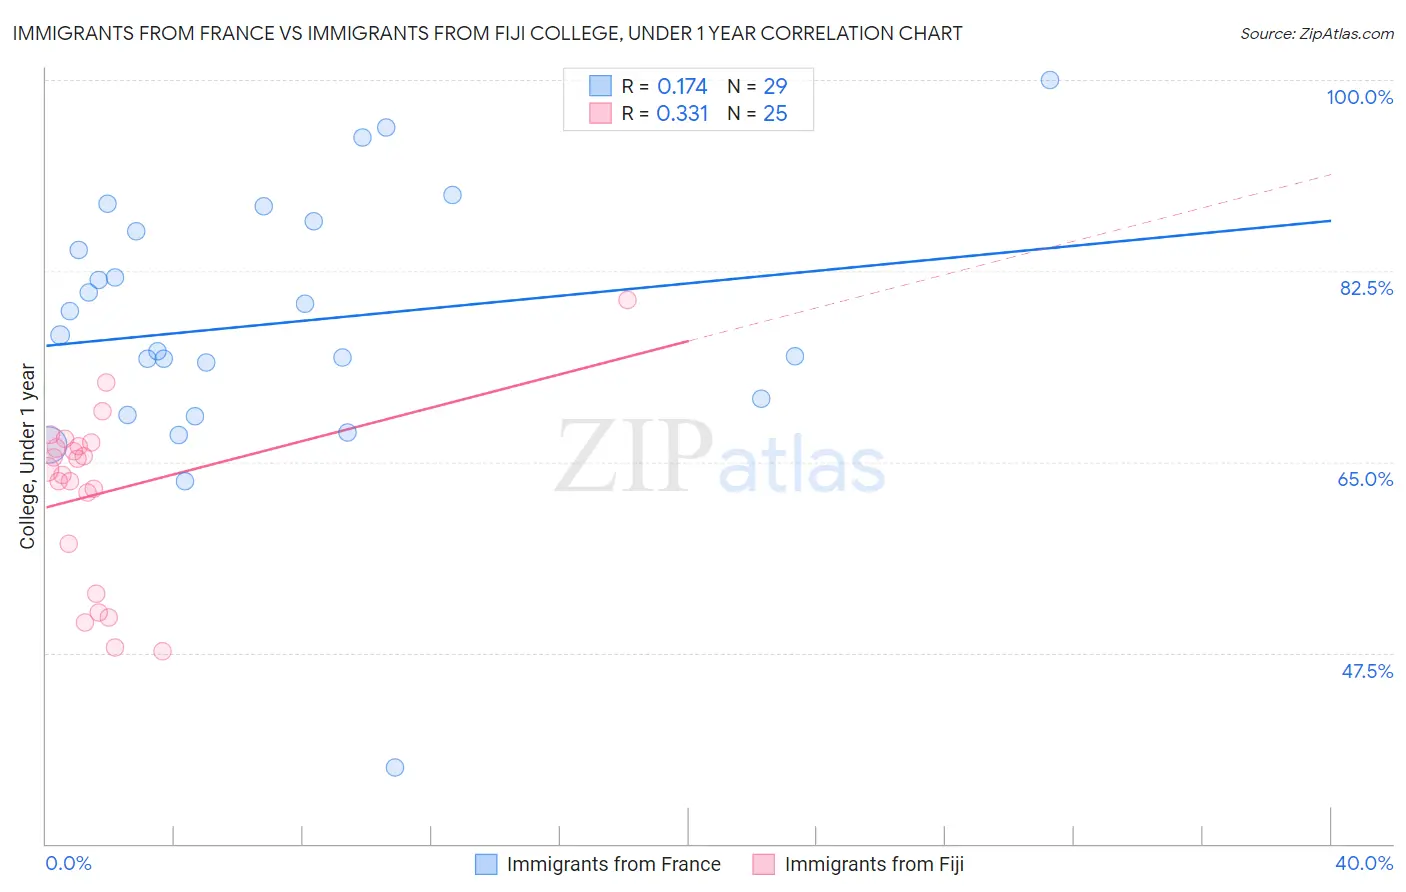
Immigrants from France vs Immigrants from Fiji College, Under 1 year Correlation Chart
The statistical analysis conducted on geographies consisting of 287,918,760 people shows a poor positive correlation between the proportion of Immigrants from France and percentage of population with at least college, under 1 year education in the United States with a correlation coefficient (R) of 0.174 and weighted average of 71.0%. Similarly, the statistical analysis conducted on geographies consisting of 93,755,737 people shows a mild positive correlation between the proportion of Immigrants from Fiji and percentage of population with at least college, under 1 year education in the United States with a correlation coefficient (R) of 0.331 and weighted average of 63.4%, a difference of 12.0%.
College, Under 1 year Correlation Summary
| Measurement | Immigrants from France | Immigrants from Fiji |
| Minimum | 37.0% | 47.6% |
| Maximum | 100.0% | 79.8% |
| Range | 63.0% | 32.2% |
| Mean | 77.7% | 62.2% |
| Median | 76.6% | 64.3% |
| Interquartile 25% (IQ1) | 70.0% | 55.2% |
| Interquartile 75% (IQ3) | 86.6% | 66.6% |
| Interquartile Range (IQR) | 16.6% | 11.3% |
| Standard Deviation (Sample) | 12.2% | 8.0% |
| Standard Deviation (Population) | 12.0% | 7.9% |
Similar Demographics by College, Under 1 year
Demographics Similar to Immigrants from France by College, Under 1 year
In terms of college, under 1 year, the demographic groups most similar to Immigrants from France are Immigrants from Hong Kong (71.0%, a difference of 0.0%), Immigrants from Ireland (71.0%, a difference of 0.030%), Immigrants from Denmark (71.0%, a difference of 0.040%), Bulgarian (71.1%, a difference of 0.15%), and Soviet Union (71.1%, a difference of 0.17%).
| Demographics | Rating | Rank | College, Under 1 year |
| Immigrants | Eastern Asia | 100.0 /100 | #22 | Exceptional 71.3% |
| Immigrants | Northern Europe | 100.0 /100 | #23 | Exceptional 71.1% |
| Soviet Union | 100.0 /100 | #24 | Exceptional 71.1% |
| Bulgarians | 100.0 /100 | #25 | Exceptional 71.1% |
| Immigrants | Denmark | 100.0 /100 | #26 | Exceptional 71.0% |
| Immigrants | Ireland | 100.0 /100 | #27 | Exceptional 71.0% |
| Immigrants | Hong Kong | 100.0 /100 | #28 | Exceptional 71.0% |
| Immigrants | France | 100.0 /100 | #29 | Exceptional 71.0% |
| Immigrants | China | 99.9 /100 | #30 | Exceptional 70.9% |
| Indians (Asian) | 99.9 /100 | #31 | Exceptional 70.8% |
| Turks | 99.9 /100 | #32 | Exceptional 70.7% |
| Immigrants | South Africa | 99.9 /100 | #33 | Exceptional 70.6% |
| Estonians | 99.9 /100 | #34 | Exceptional 70.6% |
| Russians | 99.9 /100 | #35 | Exceptional 70.5% |
| Immigrants | Sri Lanka | 99.9 /100 | #36 | Exceptional 70.5% |
Demographics Similar to Immigrants from Fiji by College, Under 1 year
In terms of college, under 1 year, the demographic groups most similar to Immigrants from Fiji are Immigrants from Panama (63.4%, a difference of 0.010%), Portuguese (63.4%, a difference of 0.020%), Immigrants from Uruguay (63.4%, a difference of 0.030%), Cree (63.3%, a difference of 0.11%), and Immigrants from Senegal (63.3%, a difference of 0.16%).
| Demographics | Rating | Rank | College, Under 1 year |
| Immigrants | Middle Africa | 10.5 /100 | #212 | Poor 63.9% |
| Immigrants | South America | 9.1 /100 | #213 | Tragic 63.8% |
| Immigrants | Nigeria | 8.8 /100 | #214 | Tragic 63.7% |
| Senegalese | 7.7 /100 | #215 | Tragic 63.6% |
| Hmong | 6.8 /100 | #216 | Tragic 63.5% |
| Immigrants | Uruguay | 5.8 /100 | #217 | Tragic 63.4% |
| Immigrants | Panama | 5.7 /100 | #218 | Tragic 63.4% |
| Immigrants | Fiji | 5.7 /100 | #219 | Tragic 63.4% |
| Portuguese | 5.6 /100 | #220 | Tragic 63.4% |
| Cree | 5.2 /100 | #221 | Tragic 63.3% |
| Immigrants | Senegal | 5.0 /100 | #222 | Tragic 63.3% |
| Immigrants | Costa Rica | 4.5 /100 | #223 | Tragic 63.2% |
| Sub-Saharan Africans | 4.4 /100 | #224 | Tragic 63.2% |
| Immigrants | Peru | 4.0 /100 | #225 | Tragic 63.1% |
| Immigrants | Colombia | 4.0 /100 | #226 | Tragic 63.1% |