Immigrants from South Africa vs Immigrants from Fiji In Labor Force | Age 45-54
COMPARE
Immigrants from South Africa
Immigrants from Fiji
In Labor Force | Age 45-54
In Labor Force | Age 45-54 Comparison
Immigrants from South Africa
Immigrants from Fiji
82.8%
IN LABOR FORCE | AGE 45-54
55.8/ 100
METRIC RATING
168th/ 347
METRIC RANK
81.5%
IN LABOR FORCE | AGE 45-54
0.1/ 100
METRIC RATING
258th/ 347
METRIC RANK
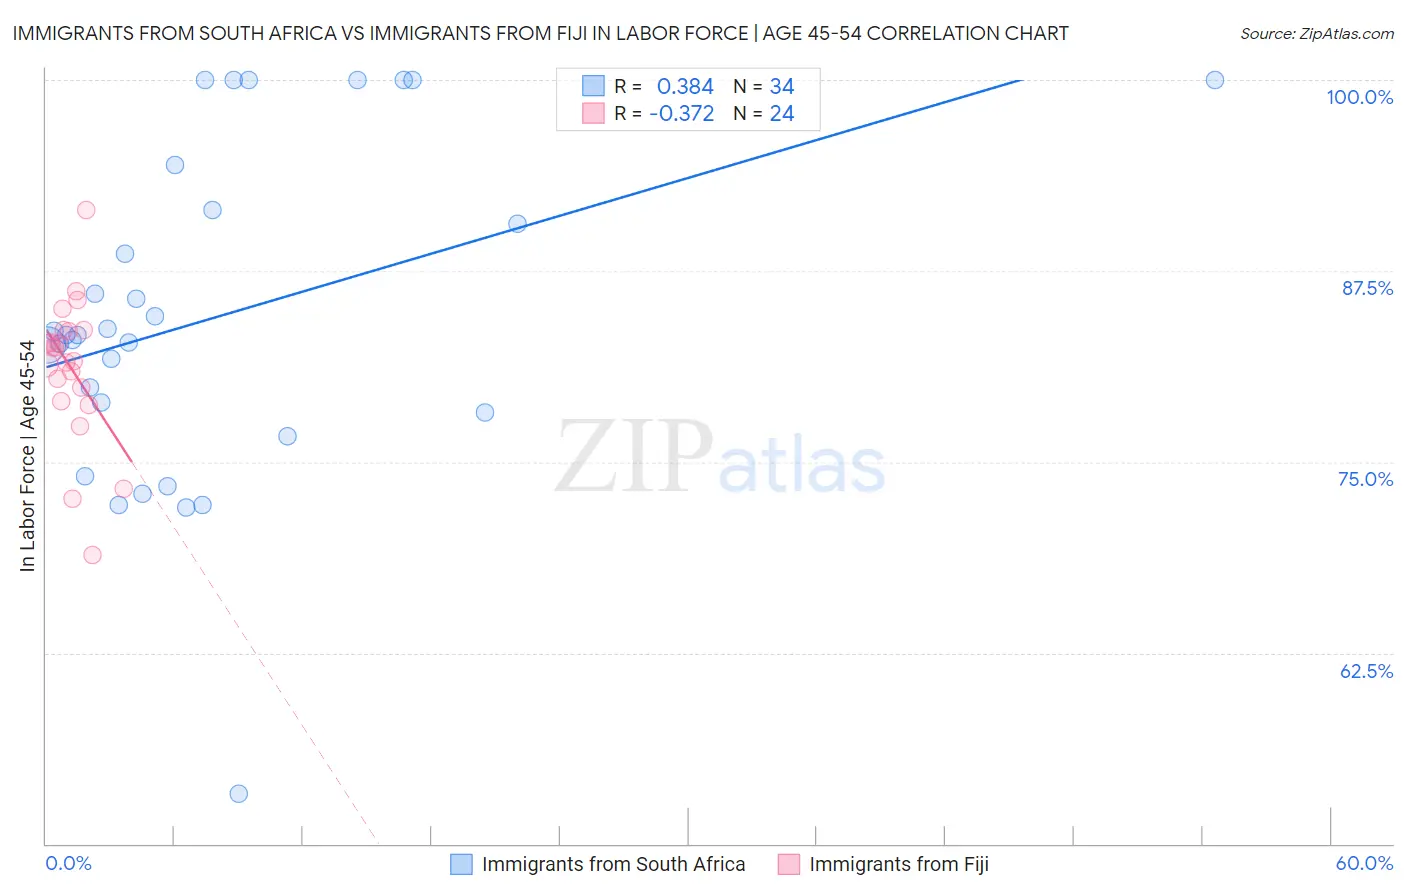
Immigrants from South Africa vs Immigrants from Fiji In Labor Force | Age 45-54 Correlation Chart
The statistical analysis conducted on geographies consisting of 233,265,537 people shows a mild positive correlation between the proportion of Immigrants from South Africa and labor force participation rate among population between the ages 45 and 54 in the United States with a correlation coefficient (R) of 0.384 and weighted average of 82.8%. Similarly, the statistical analysis conducted on geographies consisting of 93,754,712 people shows a mild negative correlation between the proportion of Immigrants from Fiji and labor force participation rate among population between the ages 45 and 54 in the United States with a correlation coefficient (R) of -0.372 and weighted average of 81.5%, a difference of 1.5%.
In Labor Force | Age 45-54 Correlation Summary
| Measurement | Immigrants from South Africa | Immigrants from Fiji |
| Minimum | 53.3% | 68.9% |
| Maximum | 100.0% | 91.5% |
| Range | 46.7% | 22.6% |
| Mean | 84.5% | 81.2% |
| Median | 83.3% | 82.0% |
| Interquartile 25% (IQ1) | 78.2% | 79.5% |
| Interquartile 75% (IQ3) | 91.5% | 83.6% |
| Interquartile Range (IQR) | 13.3% | 4.1% |
| Standard Deviation (Sample) | 10.8% | 4.7% |
| Standard Deviation (Population) | 10.7% | 4.6% |
Similar Demographics by In Labor Force | Age 45-54
Demographics Similar to Immigrants from South Africa by In Labor Force | Age 45-54
In terms of in labor force | age 45-54, the demographic groups most similar to Immigrants from South Africa are Immigrants from South Eastern Asia (82.8%, a difference of 0.010%), Swiss (82.8%, a difference of 0.010%), Immigrants from Western Africa (82.8%, a difference of 0.010%), Pakistani (82.8%, a difference of 0.020%), and Immigrants from Zaire (82.8%, a difference of 0.030%).
| Demographics | Rating | Rank | In Labor Force | Age 45-54 |
| South American Indians | 62.2 /100 | #161 | Good 82.9% |
| Haitians | 61.8 /100 | #162 | Good 82.8% |
| Dutch | 61.7 /100 | #163 | Good 82.8% |
| German Russians | 61.3 /100 | #164 | Good 82.8% |
| Immigrants | Sudan | 59.9 /100 | #165 | Average 82.8% |
| Immigrants | South Eastern Asia | 57.4 /100 | #166 | Average 82.8% |
| Swiss | 56.5 /100 | #167 | Average 82.8% |
| Immigrants | South Africa | 55.8 /100 | #168 | Average 82.8% |
| Immigrants | Western Africa | 54.1 /100 | #169 | Average 82.8% |
| Pakistanis | 53.2 /100 | #170 | Average 82.8% |
| Immigrants | Zaire | 52.9 /100 | #171 | Average 82.8% |
| Icelanders | 51.8 /100 | #172 | Average 82.8% |
| Nicaraguans | 50.3 /100 | #173 | Average 82.8% |
| Costa Ricans | 50.0 /100 | #174 | Average 82.8% |
| Immigrants | Liberia | 47.9 /100 | #175 | Average 82.7% |
Demographics Similar to Immigrants from Fiji by In Labor Force | Age 45-54
In terms of in labor force | age 45-54, the demographic groups most similar to Immigrants from Fiji are Immigrants from Congo (81.6%, a difference of 0.010%), Guyanese (81.5%, a difference of 0.010%), Barbadian (81.6%, a difference of 0.030%), Spaniard (81.5%, a difference of 0.030%), and Hawaiian (81.5%, a difference of 0.050%).
| Demographics | Rating | Rank | In Labor Force | Age 45-54 |
| Guamanians/Chamorros | 0.2 /100 | #251 | Tragic 81.6% |
| Pennsylvania Germans | 0.2 /100 | #252 | Tragic 81.6% |
| Japanese | 0.2 /100 | #253 | Tragic 81.6% |
| Immigrants | Laos | 0.2 /100 | #254 | Tragic 81.6% |
| Scotch-Irish | 0.2 /100 | #255 | Tragic 81.6% |
| Barbadians | 0.1 /100 | #256 | Tragic 81.6% |
| Immigrants | Congo | 0.1 /100 | #257 | Tragic 81.6% |
| Immigrants | Fiji | 0.1 /100 | #258 | Tragic 81.5% |
| Guyanese | 0.1 /100 | #259 | Tragic 81.5% |
| Spaniards | 0.1 /100 | #260 | Tragic 81.5% |
| Hawaiians | 0.1 /100 | #261 | Tragic 81.5% |
| Immigrants | Guyana | 0.1 /100 | #262 | Tragic 81.5% |
| Indonesians | 0.1 /100 | #263 | Tragic 81.5% |
| Immigrants | West Indies | 0.1 /100 | #264 | Tragic 81.5% |
| Hondurans | 0.1 /100 | #265 | Tragic 81.4% |