Vietnamese vs Immigrants from Fiji College, Under 1 year
COMPARE
Vietnamese
Immigrants from Fiji
College, Under 1 year
College, Under 1 year Comparison
Vietnamese
Immigrants from Fiji
61.7%
COLLEGE, UNDER 1 YEAR
0.5/ 100
METRIC RATING
249th/ 347
METRIC RANK
63.4%
COLLEGE, UNDER 1 YEAR
5.7/ 100
METRIC RATING
219th/ 347
METRIC RANK
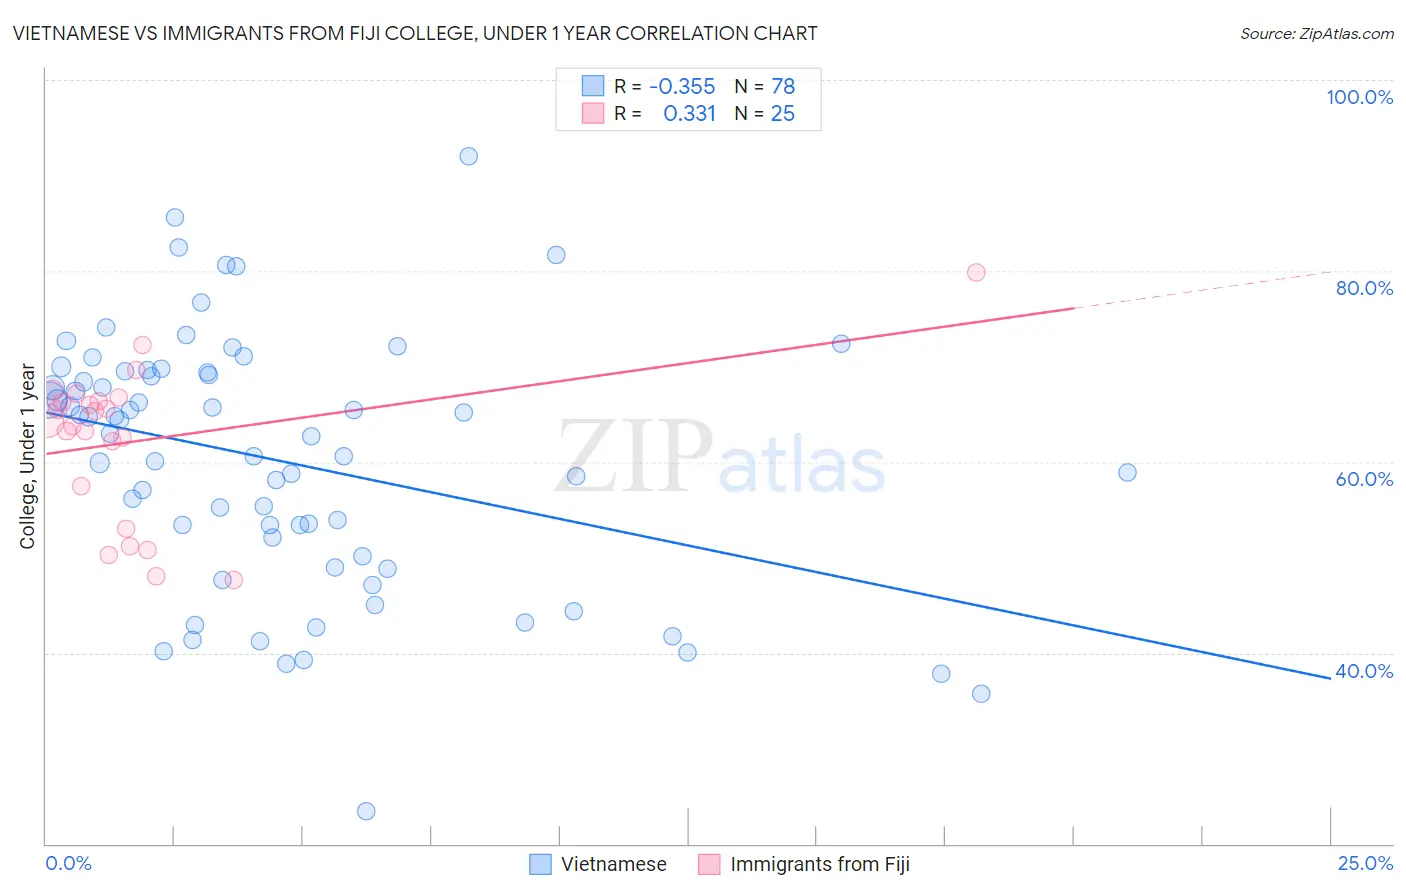
Vietnamese vs Immigrants from Fiji College, Under 1 year Correlation Chart
The statistical analysis conducted on geographies consisting of 170,751,543 people shows a mild negative correlation between the proportion of Vietnamese and percentage of population with at least college, under 1 year education in the United States with a correlation coefficient (R) of -0.355 and weighted average of 61.7%. Similarly, the statistical analysis conducted on geographies consisting of 93,755,737 people shows a mild positive correlation between the proportion of Immigrants from Fiji and percentage of population with at least college, under 1 year education in the United States with a correlation coefficient (R) of 0.331 and weighted average of 63.4%, a difference of 2.8%.
College, Under 1 year Correlation Summary
| Measurement | Vietnamese | Immigrants from Fiji |
| Minimum | 23.5% | 47.6% |
| Maximum | 92.0% | 79.8% |
| Range | 68.6% | 32.2% |
| Mean | 60.1% | 62.2% |
| Median | 62.8% | 64.3% |
| Interquartile 25% (IQ1) | 50.1% | 55.2% |
| Interquartile 75% (IQ3) | 69.4% | 66.6% |
| Interquartile Range (IQR) | 19.3% | 11.3% |
| Standard Deviation (Sample) | 13.4% | 8.0% |
| Standard Deviation (Population) | 13.3% | 7.9% |
Similar Demographics by College, Under 1 year
Demographics Similar to Vietnamese by College, Under 1 year
In terms of college, under 1 year, the demographic groups most similar to Vietnamese are Immigrants from Congo (61.7%, a difference of 0.0%), Potawatomi (61.8%, a difference of 0.16%), Immigrants from Micronesia (61.5%, a difference of 0.19%), West Indian (61.5%, a difference of 0.30%), and Japanese (61.5%, a difference of 0.30%).
| Demographics | Rating | Rank | College, Under 1 year |
| Malaysians | 1.1 /100 | #242 | Tragic 62.2% |
| Hawaiians | 1.1 /100 | #243 | Tragic 62.1% |
| Colville | 1.0 /100 | #244 | Tragic 62.1% |
| Delaware | 0.9 /100 | #245 | Tragic 62.1% |
| Marshallese | 0.8 /100 | #246 | Tragic 61.9% |
| Immigrants | Liberia | 0.8 /100 | #247 | Tragic 61.9% |
| Potawatomi | 0.6 /100 | #248 | Tragic 61.8% |
| Vietnamese | 0.5 /100 | #249 | Tragic 61.7% |
| Immigrants | Congo | 0.5 /100 | #250 | Tragic 61.7% |
| Immigrants | Micronesia | 0.5 /100 | #251 | Tragic 61.5% |
| West Indians | 0.4 /100 | #252 | Tragic 61.5% |
| Japanese | 0.4 /100 | #253 | Tragic 61.5% |
| Immigrants | Cambodia | 0.4 /100 | #254 | Tragic 61.5% |
| Comanche | 0.4 /100 | #255 | Tragic 61.4% |
| Bangladeshis | 0.4 /100 | #256 | Tragic 61.4% |
Demographics Similar to Immigrants from Fiji by College, Under 1 year
In terms of college, under 1 year, the demographic groups most similar to Immigrants from Fiji are Immigrants from Panama (63.4%, a difference of 0.010%), Portuguese (63.4%, a difference of 0.020%), Immigrants from Uruguay (63.4%, a difference of 0.030%), Cree (63.3%, a difference of 0.11%), and Immigrants from Senegal (63.3%, a difference of 0.16%).
| Demographics | Rating | Rank | College, Under 1 year |
| Immigrants | Middle Africa | 10.5 /100 | #212 | Poor 63.9% |
| Immigrants | South America | 9.1 /100 | #213 | Tragic 63.8% |
| Immigrants | Nigeria | 8.8 /100 | #214 | Tragic 63.7% |
| Senegalese | 7.7 /100 | #215 | Tragic 63.6% |
| Hmong | 6.8 /100 | #216 | Tragic 63.5% |
| Immigrants | Uruguay | 5.8 /100 | #217 | Tragic 63.4% |
| Immigrants | Panama | 5.7 /100 | #218 | Tragic 63.4% |
| Immigrants | Fiji | 5.7 /100 | #219 | Tragic 63.4% |
| Portuguese | 5.6 /100 | #220 | Tragic 63.4% |
| Cree | 5.2 /100 | #221 | Tragic 63.3% |
| Immigrants | Senegal | 5.0 /100 | #222 | Tragic 63.3% |
| Immigrants | Costa Rica | 4.5 /100 | #223 | Tragic 63.2% |
| Sub-Saharan Africans | 4.4 /100 | #224 | Tragic 63.2% |
| Immigrants | Peru | 4.0 /100 | #225 | Tragic 63.1% |
| Immigrants | Colombia | 4.0 /100 | #226 | Tragic 63.1% |