Immigrants from Singapore vs Immigrants from Dominica In Labor Force | Age > 16
COMPARE
Immigrants from Singapore
Immigrants from Dominica
In Labor Force | Age > 16
In Labor Force | Age > 16 Comparison
Immigrants from Singapore
Immigrants from Dominica
66.2%
IN LABOR FORCE | AGE > 16
99.7/ 100
METRIC RATING
75th/ 347
METRIC RANK
64.5%
IN LABOR FORCE | AGE > 16
3.5/ 100
METRIC RATING
241st/ 347
METRIC RANK
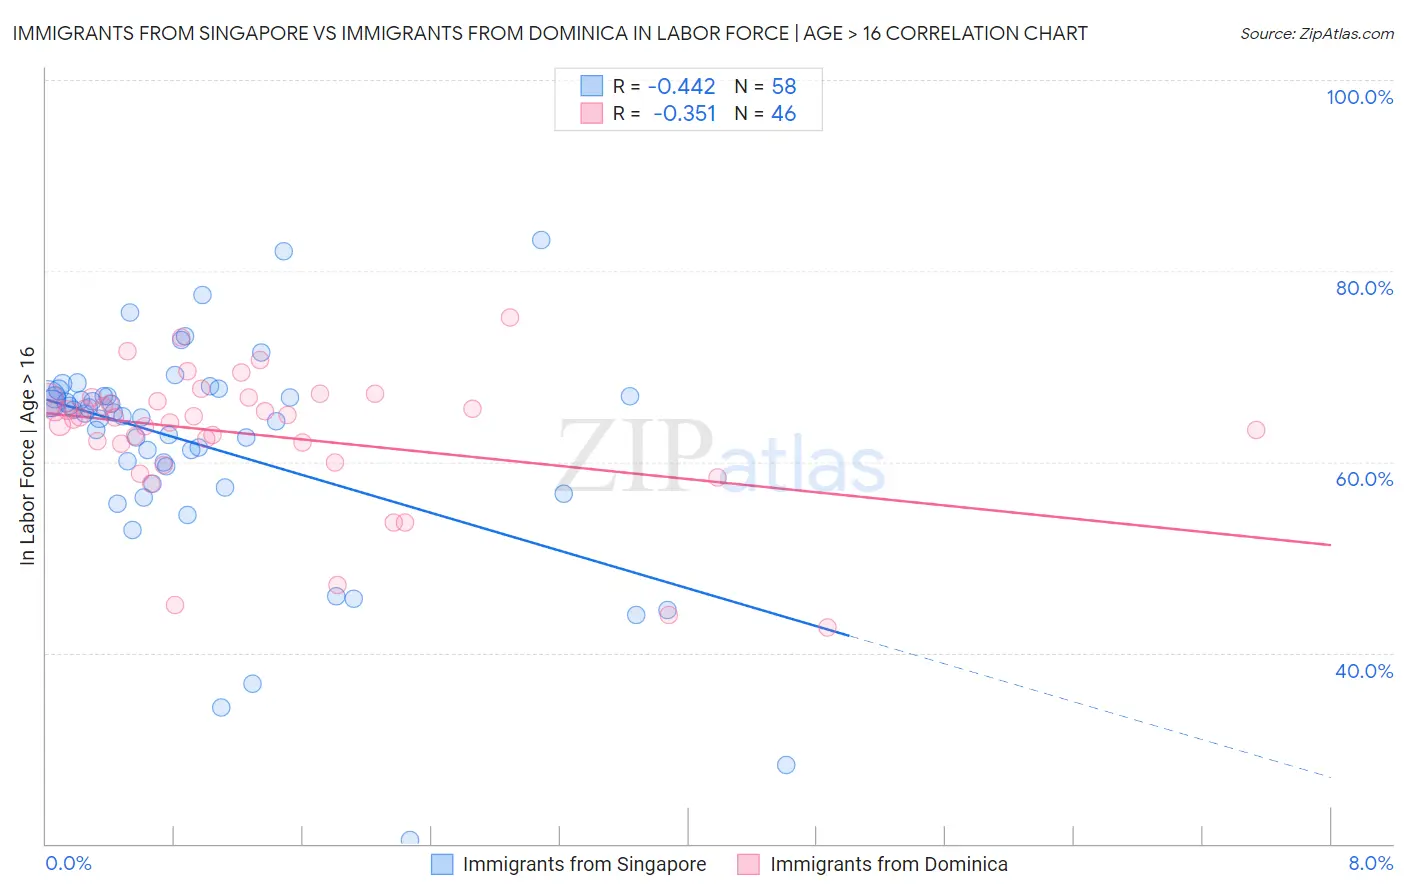
Immigrants from Singapore vs Immigrants from Dominica In Labor Force | Age > 16 Correlation Chart
The statistical analysis conducted on geographies consisting of 137,522,009 people shows a moderate negative correlation between the proportion of Immigrants from Singapore and labor force participation rate among population ages 16 and over in the United States with a correlation coefficient (R) of -0.442 and weighted average of 66.2%. Similarly, the statistical analysis conducted on geographies consisting of 83,796,433 people shows a mild negative correlation between the proportion of Immigrants from Dominica and labor force participation rate among population ages 16 and over in the United States with a correlation coefficient (R) of -0.351 and weighted average of 64.5%, a difference of 2.6%.
In Labor Force | Age > 16 Correlation Summary
| Measurement | Immigrants from Singapore | Immigrants from Dominica |
| Minimum | 20.4% | 42.6% |
| Maximum | 83.2% | 75.1% |
| Range | 62.8% | 32.5% |
| Mean | 61.5% | 62.8% |
| Median | 64.9% | 64.7% |
| Interquartile 25% (IQ1) | 57.8% | 62.0% |
| Interquartile 75% (IQ3) | 66.9% | 66.6% |
| Interquartile Range (IQR) | 9.1% | 4.6% |
| Standard Deviation (Sample) | 11.7% | 7.1% |
| Standard Deviation (Population) | 11.6% | 7.0% |
Similar Demographics by In Labor Force | Age > 16
Demographics Similar to Immigrants from Singapore by In Labor Force | Age > 16
In terms of in labor force | age > 16, the demographic groups most similar to Immigrants from Singapore are Immigrants from Vietnam (66.2%, a difference of 0.010%), Immigrants from Korea (66.2%, a difference of 0.010%), Burmese (66.2%, a difference of 0.020%), Taiwanese (66.2%, a difference of 0.020%), and Asian (66.2%, a difference of 0.040%).
| Demographics | Rating | Rank | In Labor Force | Age > 16 |
| Immigrants | Egypt | 99.7 /100 | #68 | Exceptional 66.2% |
| Sub-Saharan Africans | 99.7 /100 | #69 | Exceptional 66.2% |
| Asians | 99.7 /100 | #70 | Exceptional 66.2% |
| Burmese | 99.7 /100 | #71 | Exceptional 66.2% |
| Taiwanese | 99.7 /100 | #72 | Exceptional 66.2% |
| Immigrants | Vietnam | 99.7 /100 | #73 | Exceptional 66.2% |
| Immigrants | Korea | 99.7 /100 | #74 | Exceptional 66.2% |
| Immigrants | Singapore | 99.7 /100 | #75 | Exceptional 66.2% |
| Immigrants | Malaysia | 99.6 /100 | #76 | Exceptional 66.1% |
| Immigrants | Moldova | 99.6 /100 | #77 | Exceptional 66.1% |
| Immigrants | Asia | 99.6 /100 | #78 | Exceptional 66.1% |
| Turks | 99.6 /100 | #79 | Exceptional 66.1% |
| Malaysians | 99.6 /100 | #80 | Exceptional 66.1% |
| Moroccans | 99.5 /100 | #81 | Exceptional 66.1% |
| German Russians | 99.4 /100 | #82 | Exceptional 66.1% |
Demographics Similar to Immigrants from Dominica by In Labor Force | Age > 16
In terms of in labor force | age > 16, the demographic groups most similar to Immigrants from Dominica are Immigrants from Bangladesh (64.5%, a difference of 0.0%), Immigrants from Netherlands (64.5%, a difference of 0.010%), Immigrants from Hungary (64.5%, a difference of 0.020%), Lebanese (64.5%, a difference of 0.030%), and Immigrants from Lebanon (64.5%, a difference of 0.030%).
| Demographics | Rating | Rank | In Labor Force | Age > 16 |
| Vietnamese | 4.7 /100 | #234 | Tragic 64.6% |
| Austrians | 4.6 /100 | #235 | Tragic 64.6% |
| Immigrants | Norway | 4.6 /100 | #236 | Tragic 64.6% |
| Italians | 4.6 /100 | #237 | Tragic 64.6% |
| Lebanese | 3.9 /100 | #238 | Tragic 64.5% |
| Immigrants | Hungary | 3.8 /100 | #239 | Tragic 64.5% |
| Immigrants | Bangladesh | 3.6 /100 | #240 | Tragic 64.5% |
| Immigrants | Dominica | 3.5 /100 | #241 | Tragic 64.5% |
| Immigrants | Netherlands | 3.4 /100 | #242 | Tragic 64.5% |
| Immigrants | Lebanon | 3.2 /100 | #243 | Tragic 64.5% |
| Tsimshian | 3.1 /100 | #244 | Tragic 64.5% |
| West Indians | 3.0 /100 | #245 | Tragic 64.5% |
| Immigrants | Caribbean | 2.3 /100 | #246 | Tragic 64.4% |
| Swiss | 2.1 /100 | #247 | Tragic 64.4% |
| Immigrants | Barbados | 2.1 /100 | #248 | Tragic 64.4% |