Immigrants from Israel vs Greek College, 1 year or more
COMPARE
Immigrants from Israel
Greek
College, 1 year or more
College, 1 year or more Comparison
Immigrants from Israel
Greeks
67.8%
COLLEGE, 1 YEAR OR MORE
100.0/ 100
METRIC RATING
9th/ 347
METRIC RANK
62.6%
COLLEGE, 1 YEAR OR MORE
98.3/ 100
METRIC RATING
88th/ 347
METRIC RANK
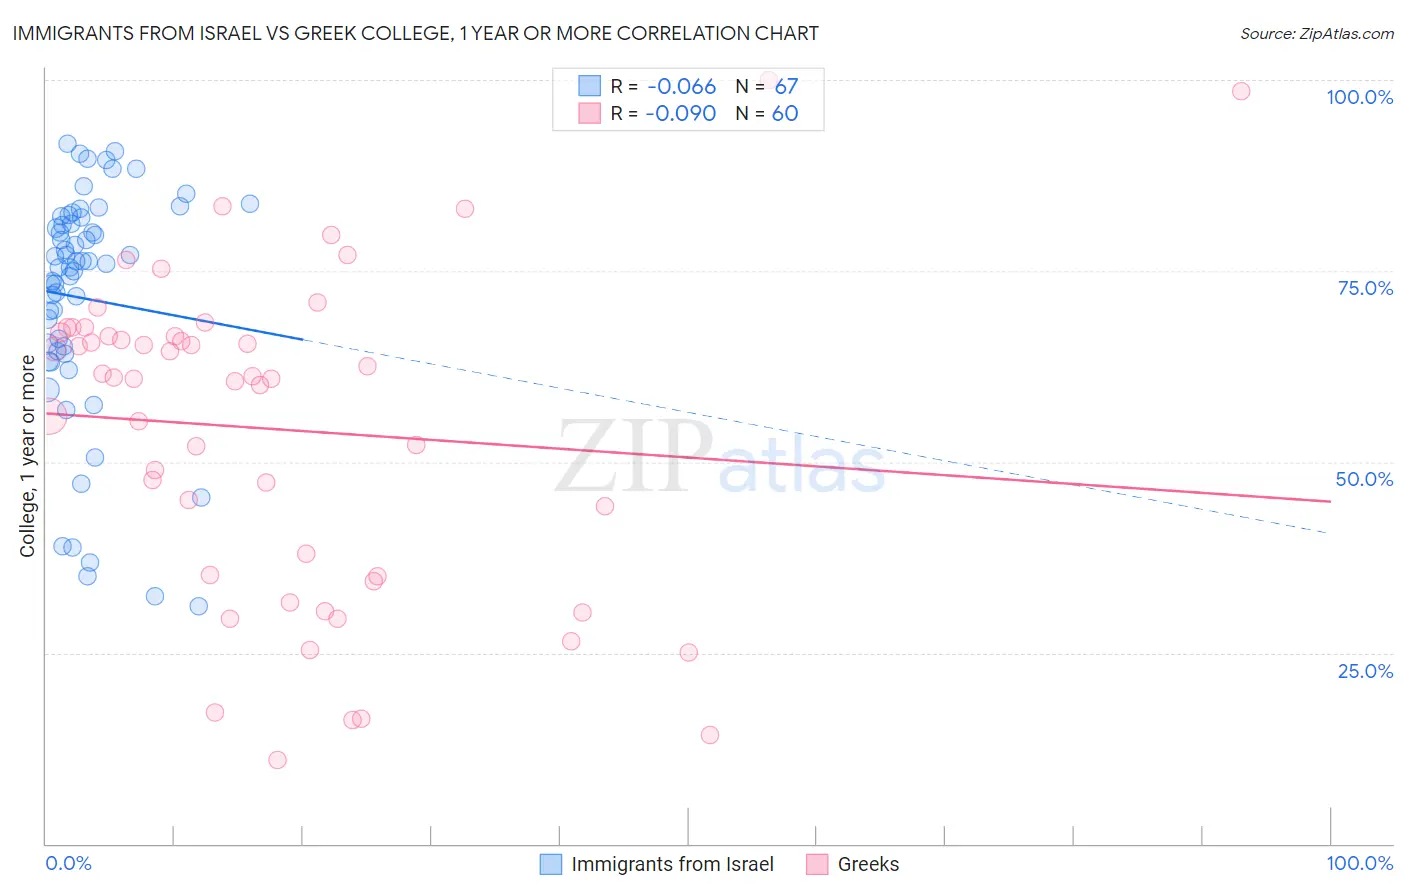
Immigrants from Israel vs Greek College, 1 year or more Correlation Chart
The statistical analysis conducted on geographies consisting of 210,030,735 people shows a slight negative correlation between the proportion of Immigrants from Israel and percentage of population with at least college, 1 year or more education in the United States with a correlation coefficient (R) of -0.066 and weighted average of 67.8%. Similarly, the statistical analysis conducted on geographies consisting of 482,770,265 people shows a slight negative correlation between the proportion of Greeks and percentage of population with at least college, 1 year or more education in the United States with a correlation coefficient (R) of -0.090 and weighted average of 62.6%, a difference of 8.3%.
College, 1 year or more Correlation Summary
| Measurement | Immigrants from Israel | Greek |
| Minimum | 31.0% | 10.9% |
| Maximum | 91.7% | 100.0% |
| Range | 60.7% | 89.1% |
| Mean | 71.4% | 54.3% |
| Median | 75.9% | 61.0% |
| Interquartile 25% (IQ1) | 64.4% | 35.1% |
| Interquartile 75% (IQ3) | 82.0% | 66.7% |
| Interquartile Range (IQR) | 17.6% | 31.6% |
| Standard Deviation (Sample) | 15.2% | 20.9% |
| Standard Deviation (Population) | 15.1% | 20.8% |
Similar Demographics by College, 1 year or more
Demographics Similar to Immigrants from Israel by College, 1 year or more
In terms of college, 1 year or more, the demographic groups most similar to Immigrants from Israel are Immigrants from Australia (67.7%, a difference of 0.22%), Immigrants from South Central Asia (67.1%, a difference of 0.99%), Thai (68.6%, a difference of 1.2%), Cypriot (67.0%, a difference of 1.2%), and Immigrants from Sweden (66.8%, a difference of 1.5%).
| Demographics | Rating | Rank | College, 1 year or more |
| Immigrants | Singapore | 100.0 /100 | #2 | Exceptional 70.1% |
| Iranians | 100.0 /100 | #3 | Exceptional 70.0% |
| Immigrants | Taiwan | 100.0 /100 | #4 | Exceptional 69.6% |
| Immigrants | India | 100.0 /100 | #5 | Exceptional 69.6% |
| Immigrants | Iran | 100.0 /100 | #6 | Exceptional 69.5% |
| Okinawans | 100.0 /100 | #7 | Exceptional 69.0% |
| Thais | 100.0 /100 | #8 | Exceptional 68.6% |
| Immigrants | Israel | 100.0 /100 | #9 | Exceptional 67.8% |
| Immigrants | Australia | 100.0 /100 | #10 | Exceptional 67.7% |
| Immigrants | South Central Asia | 100.0 /100 | #11 | Exceptional 67.1% |
| Cypriots | 100.0 /100 | #12 | Exceptional 67.0% |
| Immigrants | Sweden | 100.0 /100 | #13 | Exceptional 66.8% |
| Burmese | 100.0 /100 | #14 | Exceptional 66.7% |
| Cambodians | 100.0 /100 | #15 | Exceptional 66.7% |
| Immigrants | Japan | 100.0 /100 | #16 | Exceptional 66.7% |
Demographics Similar to Greeks by College, 1 year or more
In terms of college, 1 year or more, the demographic groups most similar to Greeks are Immigrants from Ethiopia (62.6%, a difference of 0.10%), Immigrants from Hungary (62.7%, a difference of 0.17%), Immigrants from Western Europe (62.7%, a difference of 0.19%), Immigrants from Pakistan (62.8%, a difference of 0.21%), and Immigrants from England (62.8%, a difference of 0.22%).
| Demographics | Rating | Rank | College, 1 year or more |
| Laotians | 98.7 /100 | #81 | Exceptional 62.8% |
| Immigrants | Bolivia | 98.7 /100 | #82 | Exceptional 62.8% |
| Immigrants | Argentina | 98.6 /100 | #83 | Exceptional 62.8% |
| Immigrants | England | 98.6 /100 | #84 | Exceptional 62.8% |
| Immigrants | Pakistan | 98.6 /100 | #85 | Exceptional 62.8% |
| Immigrants | Western Europe | 98.6 /100 | #86 | Exceptional 62.7% |
| Immigrants | Hungary | 98.6 /100 | #87 | Exceptional 62.7% |
| Greeks | 98.3 /100 | #88 | Exceptional 62.6% |
| Immigrants | Ethiopia | 98.2 /100 | #89 | Exceptional 62.6% |
| Immigrants | Western Asia | 97.9 /100 | #90 | Exceptional 62.5% |
| Immigrants | Eastern Europe | 97.8 /100 | #91 | Exceptional 62.4% |
| Immigrants | Egypt | 97.8 /100 | #92 | Exceptional 62.4% |
| Romanians | 97.7 /100 | #93 | Exceptional 62.4% |
| Immigrants | Croatia | 97.6 /100 | #94 | Exceptional 62.3% |
| British | 97.4 /100 | #95 | Exceptional 62.3% |