Immigrants from Germany vs Greek College, 1 year or more
COMPARE
Immigrants from Germany
Greek
College, 1 year or more
College, 1 year or more Comparison
Immigrants from Germany
Greeks
60.3%
COLLEGE, 1 YEAR OR MORE
76.1/ 100
METRIC RATING
152nd/ 347
METRIC RANK
62.6%
COLLEGE, 1 YEAR OR MORE
98.3/ 100
METRIC RATING
88th/ 347
METRIC RANK
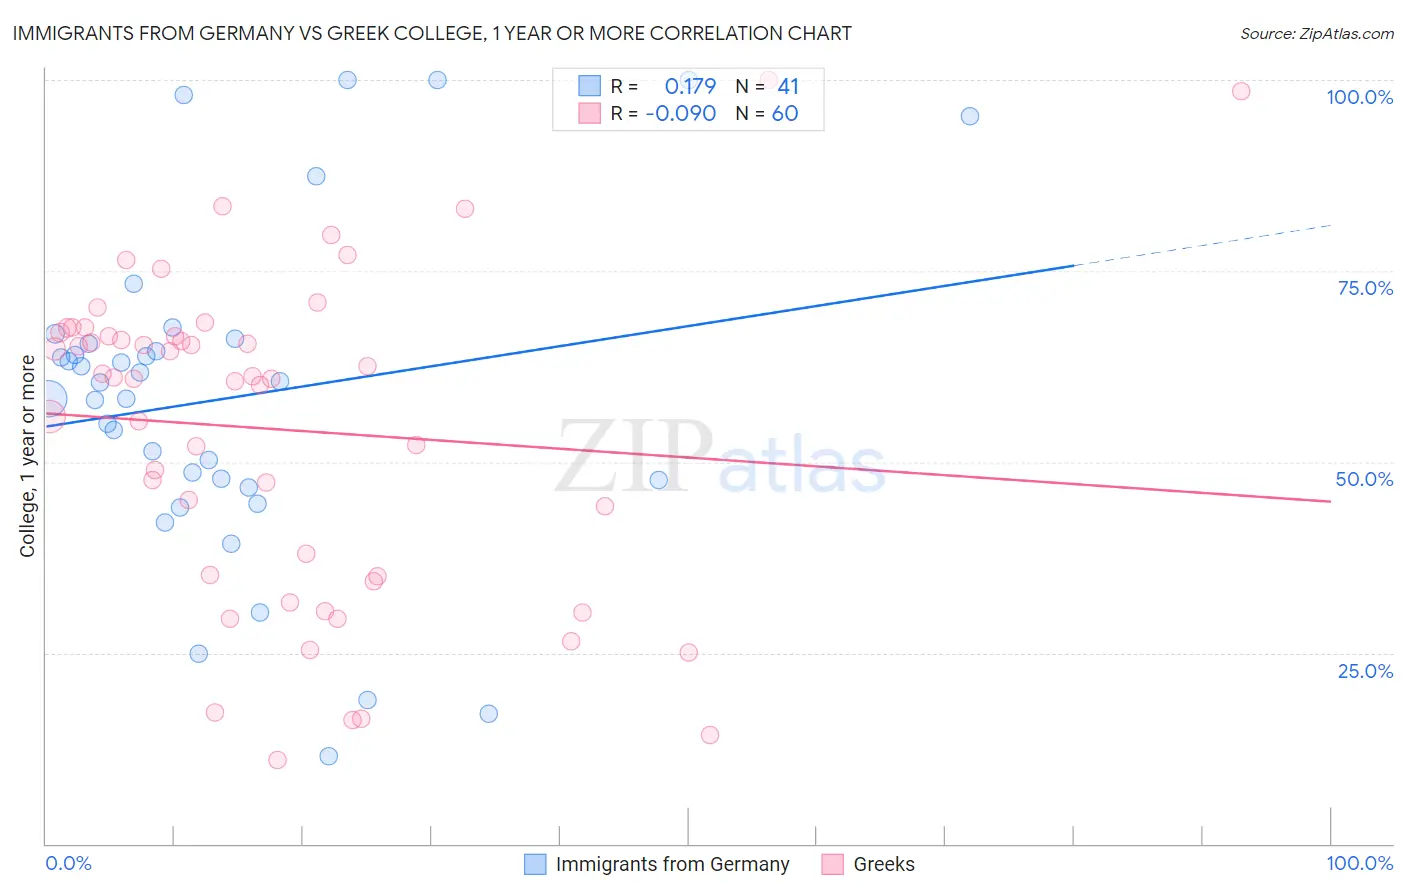
Immigrants from Germany vs Greek College, 1 year or more Correlation Chart
The statistical analysis conducted on geographies consisting of 463,883,930 people shows a poor positive correlation between the proportion of Immigrants from Germany and percentage of population with at least college, 1 year or more education in the United States with a correlation coefficient (R) of 0.179 and weighted average of 60.3%. Similarly, the statistical analysis conducted on geographies consisting of 482,770,265 people shows a slight negative correlation between the proportion of Greeks and percentage of population with at least college, 1 year or more education in the United States with a correlation coefficient (R) of -0.090 and weighted average of 62.6%, a difference of 3.8%.
College, 1 year or more Correlation Summary
| Measurement | Immigrants from Germany | Greek |
| Minimum | 11.4% | 10.9% |
| Maximum | 100.0% | 100.0% |
| Range | 88.6% | 89.1% |
| Mean | 58.4% | 54.3% |
| Median | 60.4% | 61.0% |
| Interquartile 25% (IQ1) | 47.2% | 35.1% |
| Interquartile 75% (IQ3) | 65.8% | 66.7% |
| Interquartile Range (IQR) | 18.6% | 31.6% |
| Standard Deviation (Sample) | 21.6% | 20.9% |
| Standard Deviation (Population) | 21.4% | 20.8% |
Similar Demographics by College, 1 year or more
Demographics Similar to Immigrants from Germany by College, 1 year or more
In terms of college, 1 year or more, the demographic groups most similar to Immigrants from Germany are Immigrants from Sudan (60.4%, a difference of 0.13%), Albanian (60.4%, a difference of 0.13%), Sierra Leonean (60.2%, a difference of 0.14%), Kenyan (60.5%, a difference of 0.22%), and Brazilian (60.5%, a difference of 0.22%).
| Demographics | Rating | Rank | College, 1 year or more |
| Slavs | 81.1 /100 | #145 | Excellent 60.6% |
| Scottish | 80.2 /100 | #146 | Excellent 60.5% |
| Immigrants | Kenya | 79.1 /100 | #147 | Good 60.5% |
| Kenyans | 79.0 /100 | #148 | Good 60.5% |
| Brazilians | 79.0 /100 | #149 | Good 60.5% |
| Immigrants | Sudan | 77.8 /100 | #150 | Good 60.4% |
| Albanians | 77.8 /100 | #151 | Good 60.4% |
| Immigrants | Germany | 76.1 /100 | #152 | Good 60.3% |
| Sierra Leoneans | 74.1 /100 | #153 | Good 60.2% |
| Sudanese | 73.0 /100 | #154 | Good 60.2% |
| Moroccans | 72.9 /100 | #155 | Good 60.2% |
| Finns | 72.9 /100 | #156 | Good 60.2% |
| Immigrants | Armenia | 68.8 /100 | #157 | Good 60.0% |
| English | 67.2 /100 | #158 | Good 60.0% |
| Immigrants | Iraq | 67.0 /100 | #159 | Good 60.0% |
Demographics Similar to Greeks by College, 1 year or more
In terms of college, 1 year or more, the demographic groups most similar to Greeks are Immigrants from Ethiopia (62.6%, a difference of 0.10%), Immigrants from Hungary (62.7%, a difference of 0.17%), Immigrants from Western Europe (62.7%, a difference of 0.19%), Immigrants from Pakistan (62.8%, a difference of 0.21%), and Immigrants from England (62.8%, a difference of 0.22%).
| Demographics | Rating | Rank | College, 1 year or more |
| Laotians | 98.7 /100 | #81 | Exceptional 62.8% |
| Immigrants | Bolivia | 98.7 /100 | #82 | Exceptional 62.8% |
| Immigrants | Argentina | 98.6 /100 | #83 | Exceptional 62.8% |
| Immigrants | England | 98.6 /100 | #84 | Exceptional 62.8% |
| Immigrants | Pakistan | 98.6 /100 | #85 | Exceptional 62.8% |
| Immigrants | Western Europe | 98.6 /100 | #86 | Exceptional 62.7% |
| Immigrants | Hungary | 98.6 /100 | #87 | Exceptional 62.7% |
| Greeks | 98.3 /100 | #88 | Exceptional 62.6% |
| Immigrants | Ethiopia | 98.2 /100 | #89 | Exceptional 62.6% |
| Immigrants | Western Asia | 97.9 /100 | #90 | Exceptional 62.5% |
| Immigrants | Eastern Europe | 97.8 /100 | #91 | Exceptional 62.4% |
| Immigrants | Egypt | 97.8 /100 | #92 | Exceptional 62.4% |
| Romanians | 97.7 /100 | #93 | Exceptional 62.4% |
| Immigrants | Croatia | 97.6 /100 | #94 | Exceptional 62.3% |
| British | 97.4 /100 | #95 | Exceptional 62.3% |