Bulgarian vs Immigrants from Africa College, Under 1 year
COMPARE
Bulgarian
Immigrants from Africa
College, Under 1 year
College, Under 1 year Comparison
Bulgarians
Immigrants from Africa
71.1%
COLLEGE, UNDER 1 YEAR
100.0/ 100
METRIC RATING
25th/ 347
METRIC RANK
65.3%
COLLEGE, UNDER 1 YEAR
44.7/ 100
METRIC RATING
182nd/ 347
METRIC RANK
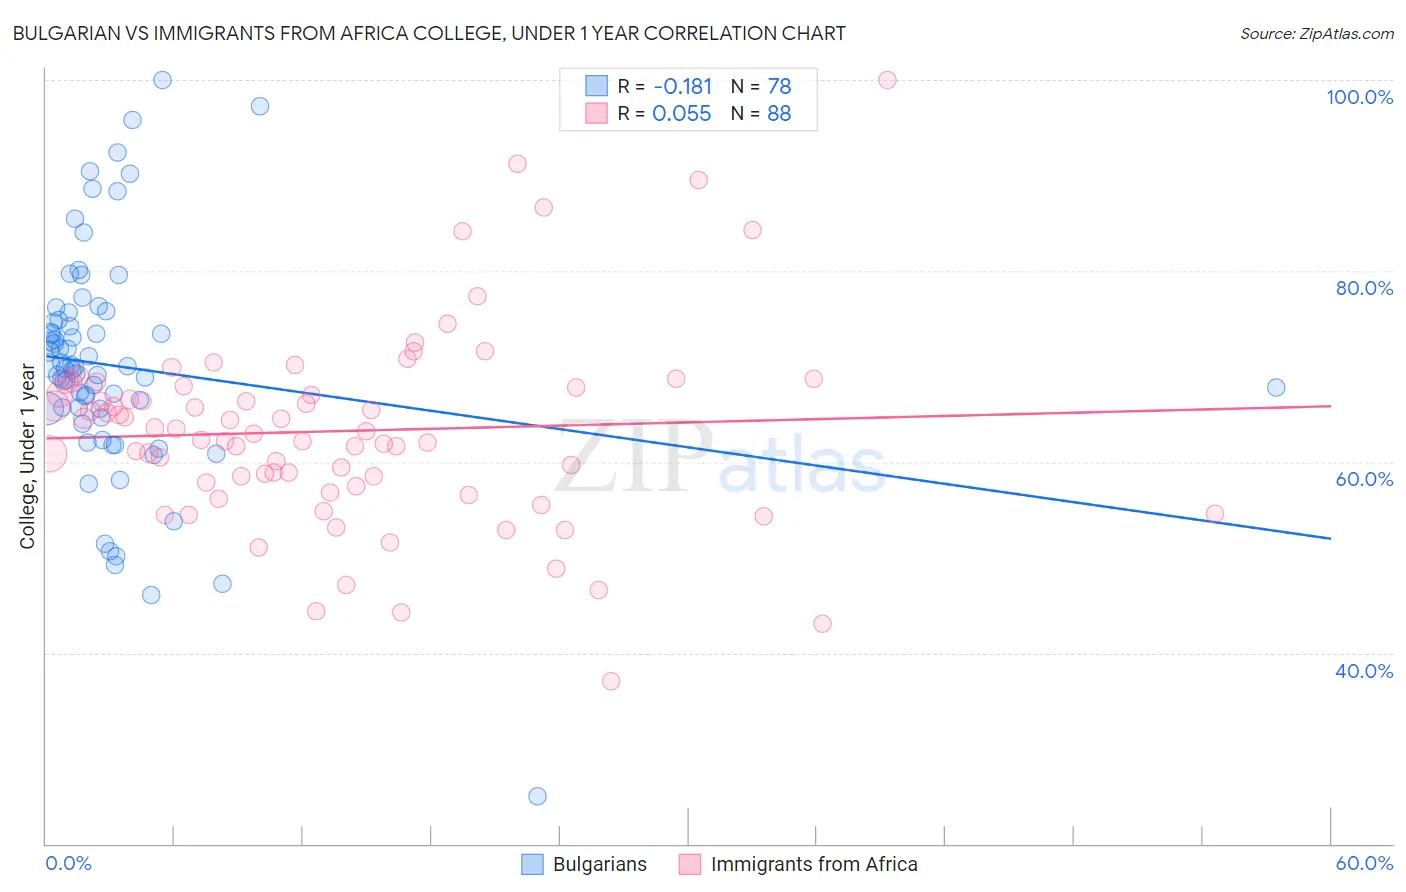
Bulgarian vs Immigrants from Africa College, Under 1 year Correlation Chart
The statistical analysis conducted on geographies consisting of 205,631,725 people shows a poor negative correlation between the proportion of Bulgarians and percentage of population with at least college, under 1 year education in the United States with a correlation coefficient (R) of -0.181 and weighted average of 71.1%. Similarly, the statistical analysis conducted on geographies consisting of 469,444,786 people shows a slight positive correlation between the proportion of Immigrants from Africa and percentage of population with at least college, under 1 year education in the United States with a correlation coefficient (R) of 0.055 and weighted average of 65.3%, a difference of 8.9%.
College, Under 1 year Correlation Summary
| Measurement | Bulgarian | Immigrants from Africa |
| Minimum | 25.0% | 37.0% |
| Maximum | 100.0% | 100.0% |
| Range | 75.0% | 63.0% |
| Mean | 70.0% | 63.2% |
| Median | 69.8% | 63.1% |
| Interquartile 25% (IQ1) | 65.6% | 57.7% |
| Interquartile 75% (IQ3) | 74.8% | 67.9% |
| Interquartile Range (IQR) | 9.3% | 10.2% |
| Standard Deviation (Sample) | 12.2% | 10.4% |
| Standard Deviation (Population) | 12.1% | 10.3% |
Similar Demographics by College, Under 1 year
Demographics Similar to Bulgarians by College, Under 1 year
In terms of college, under 1 year, the demographic groups most similar to Bulgarians are Soviet Union (71.1%, a difference of 0.020%), Immigrants from Northern Europe (71.1%, a difference of 0.030%), Immigrants from Denmark (71.0%, a difference of 0.12%), Immigrants from Ireland (71.0%, a difference of 0.13%), and Immigrants from Hong Kong (71.0%, a difference of 0.15%).
| Demographics | Rating | Rank | College, Under 1 year |
| Immigrants | Switzerland | 100.0 /100 | #18 | Exceptional 71.7% |
| Latvians | 100.0 /100 | #19 | Exceptional 71.6% |
| Immigrants | Korea | 100.0 /100 | #20 | Exceptional 71.6% |
| Immigrants | Belgium | 100.0 /100 | #21 | Exceptional 71.5% |
| Immigrants | Eastern Asia | 100.0 /100 | #22 | Exceptional 71.3% |
| Immigrants | Northern Europe | 100.0 /100 | #23 | Exceptional 71.1% |
| Soviet Union | 100.0 /100 | #24 | Exceptional 71.1% |
| Bulgarians | 100.0 /100 | #25 | Exceptional 71.1% |
| Immigrants | Denmark | 100.0 /100 | #26 | Exceptional 71.0% |
| Immigrants | Ireland | 100.0 /100 | #27 | Exceptional 71.0% |
| Immigrants | Hong Kong | 100.0 /100 | #28 | Exceptional 71.0% |
| Immigrants | France | 100.0 /100 | #29 | Exceptional 71.0% |
| Immigrants | China | 99.9 /100 | #30 | Exceptional 70.9% |
| Indians (Asian) | 99.9 /100 | #31 | Exceptional 70.8% |
| Turks | 99.9 /100 | #32 | Exceptional 70.7% |
Demographics Similar to Immigrants from Africa by College, Under 1 year
In terms of college, under 1 year, the demographic groups most similar to Immigrants from Africa are Spaniard (65.3%, a difference of 0.040%), Dutch (65.3%, a difference of 0.060%), Immigrants from Poland (65.2%, a difference of 0.10%), Bermudan (65.2%, a difference of 0.12%), and Sri Lankan (65.2%, a difference of 0.13%).
| Demographics | Rating | Rank | College, Under 1 year |
| Scotch-Irish | 49.5 /100 | #175 | Average 65.4% |
| French | 48.9 /100 | #176 | Average 65.4% |
| Immigrants | North Macedonia | 48.6 /100 | #177 | Average 65.4% |
| German Russians | 48.3 /100 | #178 | Average 65.4% |
| Guamanians/Chamorros | 48.2 /100 | #179 | Average 65.4% |
| Dutch | 46.1 /100 | #180 | Average 65.3% |
| Spaniards | 45.5 /100 | #181 | Average 65.3% |
| Immigrants | Africa | 44.7 /100 | #182 | Average 65.3% |
| Immigrants | Poland | 42.6 /100 | #183 | Average 65.2% |
| Bermudans | 42.0 /100 | #184 | Average 65.2% |
| Sri Lankans | 41.7 /100 | #185 | Average 65.2% |
| Immigrants | Sierra Leone | 39.7 /100 | #186 | Fair 65.1% |
| Immigrants | Southern Europe | 34.3 /100 | #187 | Fair 64.9% |
| Immigrants | Albania | 32.0 /100 | #188 | Fair 64.9% |
| Spanish | 31.6 /100 | #189 | Fair 64.9% |