Immigrants from Senegal vs Immigrants from Southern Europe In Labor Force | Age 35-44

COMPARE

Immigrants from Senegal
Race
Ancestry
AfghanAfricanAlaska NativeAlaskan AthabascanAlbanianAleutAlsatianAmericanApacheArabArapahoArgentineanArmenianAssyrian/Chaldean/SyriacAustralianAustrianBahamianBangladeshiBarbadianBasqueBelgianBelizeanBermudanBhutaneseBlackfeetBolivianBrazilianBritishBritish West IndianBulgarianBurmeseCajunCambodianCanadianCape VerdeanCarpatho RusynCelticCentral AmericanCentral American IndianCherokeeCheyenneChickasawChileanChineseChippewaChoctawColombianColvilleComancheCosta RicanCreeCreekCroatianCrowCubanCypriotCzechCzechoslovakianDanishDelawareDominicanDutchDutch West IndianEastern EuropeanEcuadorianEgyptianEnglishEstonianEthiopianEuropeanFijianFilipinoFinnishFrenchFrench American IndianFrench CanadianGermanGerman RussianGhanaianGreekGuamanian/ChamorroGuatemalanGuyaneseHaitianHmongHonduranHopiHoumaHungarianIcelanderIndian (Asian)IndonesianInupiatIranianIraqiIrishIroquoisIsraeliItalianJamaicanJapaneseJordanianKenyanKiowaKoreanLaotianLatvianLebaneseLiberianLithuanianLumbeeLuxembourgerMacedonianMalaysianMalteseMarshalleseMenomineeMexicanMexican American IndianMongolianMoroccanNative HawaiianNavajoNepaleseNew ZealanderNicaraguanNigerianNorthern EuropeanNorwegianOkinawanOsageOttawaPaiutePakistaniPalestinianPanamanianParaguayanPennsylvania GermanPeruvianPimaPolishPortuguesePotawatomiPuebloPuerto RicanPuget Sound SalishRomanianRussianSalvadoranSamoanScandinavianScotch-IrishScottishSeminoleSenegaleseSerbianShoshoneSierra LeoneanSiouxSlavicSlovakSloveneSomaliSouth AfricanSouth AmericanSouth American IndianSoviet UnionSpaniardSpanishSpanish AmericanSpanish American IndianSri LankanSubsaharan AfricanSudaneseSwedishSwissSyrianTaiwaneseThaiTlingit-HaidaTohono O'OdhamTonganTrinidadian and TobagonianTsimshianTurkishU.S. Virgin IslanderUgandanUkrainianUruguayanUteVenezuelanVietnameseWelshWest IndianYakamaYaquiYugoslavianYumanYup'ikZimbabwean
Immigration
NonimmigrantsImmigrantsAfghanistanAfricaAlbaniaArgentinaArmeniaAsiaAustraliaAustriaBahamasBangladeshBarbadosBelarusBelgiumBelizeBoliviaBosnia and HerzegovinaBrazilBulgariaBurma/MyanmarCabo VerdeCambodiaCameroonCanadaCaribbeanCentral AmericaChileChinaColombiaCongoCosta RicaCroatiaCubaCzechoslovakiaDenmarkDominicaDominican RepublicEastern AfricaEastern AsiaEastern EuropeEcuadorEgyptEl SalvadorEnglandEritreaEthiopiaEuropeFijiFranceGermanyGhanaGreeceGrenadaGuatemalaGuyanaHaitiHondurasHong KongHungaryIndiaIndonesiaIranIraqIrelandIsraelItalyJamaicaJapanJordanKazakhstanKenyaKoreaKuwaitLaosLatin AmericaLatviaLebanonLiberiaLithuaniaMalaysiaMexicoMicronesiaMiddle AfricaMoldovaMoroccoNepalNetherlandsNicaraguaNigeriaNorth AmericaNorth MacedoniaNorthern AfricaNorthern EuropeNorwayOceaniaPakistanPanamaPeruPhilippinesPolandPortugalRomaniaRussiaSaudi ArabiaScotlandSenegalSerbiaSierra LeoneSingaporeSomaliaSouth AfricaSouth AmericaSouth Central AsiaSouth Eastern AsiaSpainSri LankaSt. Vincent and the GrenadinesSudanSwedenSwitzerlandSyriaTaiwanThailandTrinidad and TobagoTurkeyUgandaUkraineUruguayUzbekistanVenezuelaVietnamWest IndiesWestern AfricaWestern AsiaWestern EuropeYemenZaireZimbabweAzores
Immigrants from Southern Europe
Race
Ancestry
AfghanAfricanAlaska NativeAlaskan AthabascanAlbanianAleutAlsatianAmericanApacheArabArapahoArgentineanArmenianAssyrian/Chaldean/SyriacAustralianAustrianBahamianBangladeshiBarbadianBasqueBelgianBelizeanBermudanBhutaneseBlackfeetBolivianBrazilianBritishBritish West IndianBulgarianBurmeseCajunCambodianCanadianCape VerdeanCarpatho RusynCelticCentral AmericanCentral American IndianCherokeeCheyenneChickasawChileanChineseChippewaChoctawColombianColvilleComancheCosta RicanCreeCreekCroatianCrowCubanCypriotCzechCzechoslovakianDanishDelawareDominicanDutchDutch West IndianEastern EuropeanEcuadorianEgyptianEnglishEstonianEthiopianEuropeanFijianFilipinoFinnishFrenchFrench American IndianFrench CanadianGermanGerman RussianGhanaianGreekGuamanian/ChamorroGuatemalanGuyaneseHaitianHmongHonduranHopiHoumaHungarianIcelanderIndian (Asian)IndonesianInupiatIranianIraqiIrishIroquoisIsraeliItalianJamaicanJapaneseJordanianKenyanKiowaKoreanLaotianLatvianLebaneseLiberianLithuanianLumbeeLuxembourgerMacedonianMalaysianMalteseMarshalleseMenomineeMexicanMexican American IndianMongolianMoroccanNative HawaiianNavajoNepaleseNew ZealanderNicaraguanNigerianNorthern EuropeanNorwegianOkinawanOsageOttawaPaiutePakistaniPalestinianPanamanianParaguayanPennsylvania GermanPeruvianPimaPolishPortuguesePotawatomiPuebloPuerto RicanPuget Sound SalishRomanianRussianSalvadoranSamoanScandinavianScotch-IrishScottishSeminoleSenegaleseSerbianShoshoneSierra LeoneanSiouxSlavicSlovakSloveneSomaliSouth AfricanSouth AmericanSouth American IndianSoviet UnionSpaniardSpanishSpanish AmericanSpanish American IndianSri LankanSubsaharan AfricanSudaneseSwedishSwissSyrianTaiwaneseThaiTlingit-HaidaTohono O'OdhamTonganTrinidadian and TobagonianTsimshianTurkishU.S. Virgin IslanderUgandanUkrainianUruguayanUteVenezuelanVietnameseWelshWest IndianYakamaYaquiYugoslavianYumanYup'ikZimbabwean
Immigration
NonimmigrantsImmigrantsAfghanistanAfricaAlbaniaArgentinaArmeniaAsiaAustraliaAustriaBahamasBangladeshBarbadosBelarusBelgiumBelizeBoliviaBosnia and HerzegovinaBrazilBulgariaBurma/MyanmarCabo VerdeCambodiaCameroonCanadaCaribbeanCentral AmericaChileChinaColombiaCongoCosta RicaCroatiaCubaCzechoslovakiaDenmarkDominicaDominican RepublicEastern AfricaEastern AsiaEastern EuropeEcuadorEgyptEl SalvadorEnglandEritreaEthiopiaEuropeFijiFranceGermanyGhanaGreeceGrenadaGuatemalaGuyanaHaitiHondurasHong KongHungaryIndiaIndonesiaIranIraqIrelandIsraelItalyJamaicaJapanJordanKazakhstanKenyaKoreaKuwaitLaosLatin AmericaLatviaLebanonLiberiaLithuaniaMalaysiaMexicoMicronesiaMiddle AfricaMoldovaMoroccoNepalNetherlandsNicaraguaNigeriaNorth AmericaNorth MacedoniaNorthern AfricaNorthern EuropeNorwayOceaniaPakistanPanamaPeruPhilippinesPolandPortugalRomaniaRussiaSaudi ArabiaScotlandSerbiaSierra LeoneSingaporeSomaliaSouth AfricaSouth AmericaSouth Central AsiaSouth Eastern AsiaSouthern EuropeSpainSri LankaSt. Vincent and the GrenadinesSudanSwedenSwitzerlandSyriaTaiwanThailandTrinidad and TobagoTurkeyUgandaUkraineUruguayUzbekistanVenezuelaVietnamWest IndiesWestern AfricaWestern AsiaWestern EuropeYemenZaireZimbabweAzores
In Labor Force | Age 35-44
Income
Poverty
Unemployment
Labor Participation
Family Structure
Vehicle Availability
Education Level
Disability

In Labor Force | Age 35-44 Comparison

Immigrants from Senegal

Immigrants from Southern Europe

Good
Exceptional
84.4%
IN LABOR FORCE | AGE 35-44
60.4/ 100
METRIC RATING
159th/ 347
METRIC RANK
84.8%
IN LABOR FORCE | AGE 35-44
95.3/ 100
METRIC RATING
102nd/ 347
METRIC RANK

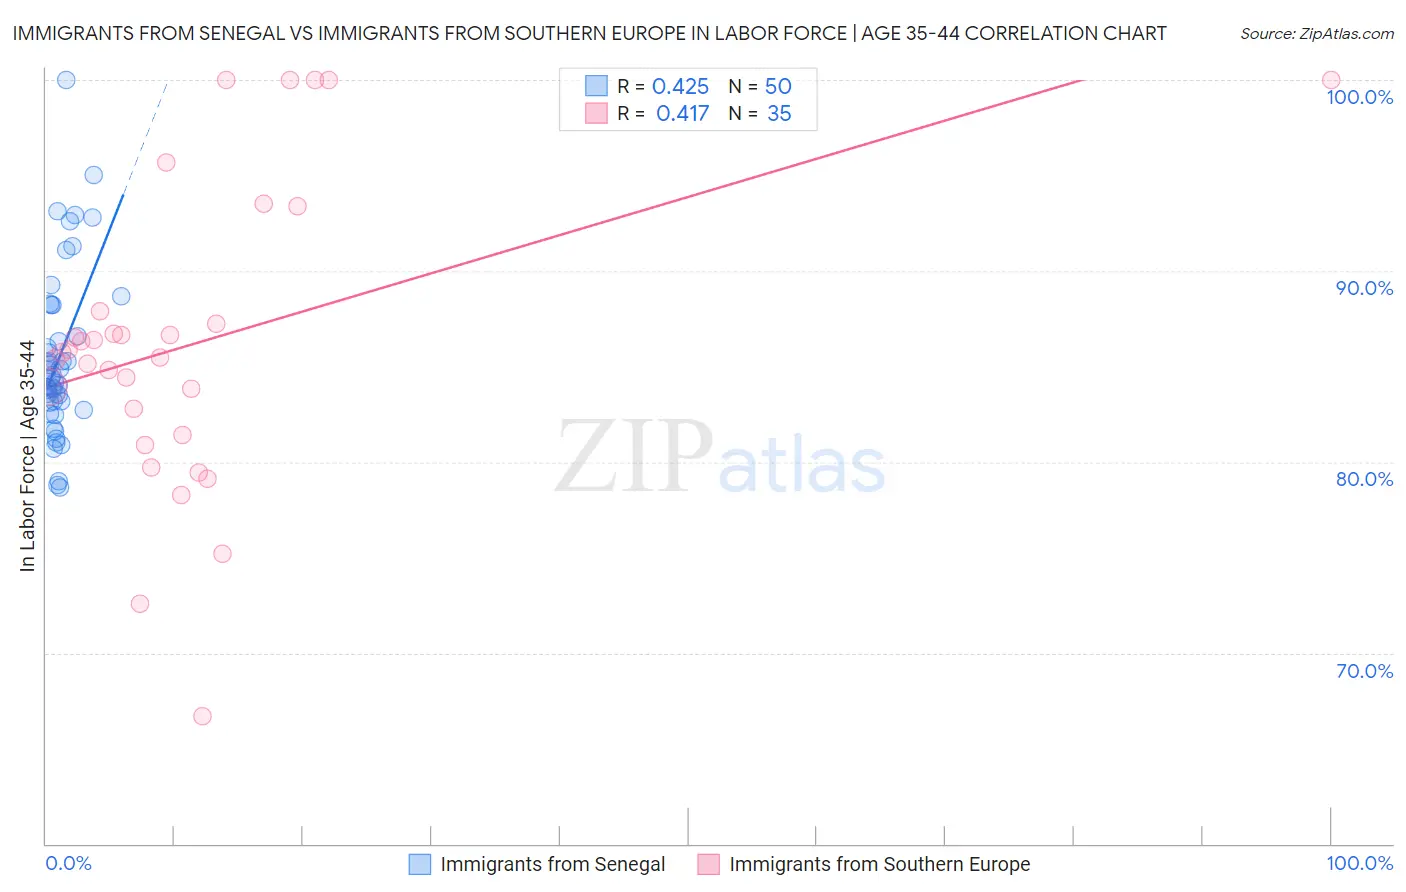
Immigrants from Senegal vs Immigrants from Southern Europe In Labor Force | Age 35-44 Correlation Chart

The statistical analysis conducted on geographies consisting of 90,121,198 people shows a moderate positive correlation between the proportion of Immigrants from Senegal and labor force participation rate among population between the ages 35 and 44 in the United States with a correlation coefficient (R) of 0.425 and weighted average of 84.4%. Similarly, the statistical analysis conducted on geographies consisting of 402,651,691 people shows a moderate positive correlation between the proportion of Immigrants from Southern Europe and labor force participation rate among population between the ages 35 and 44 in the United States with a correlation coefficient (R) of 0.417 and weighted average of 84.8%, a difference of 0.42%.
Immigrants from Senegal vs Immigrants from Southern Europe In Labor Force | Age 35-44

In Labor Force | Age 35-44 Correlation Summary

MeasurementImmigrants from SenegalImmigrants from Southern Europe
Minimum78.7%66.7%
Maximum100.0%100.0%
Range21.3%33.3%
Mean85.5%86.2%
Median84.5%85.7%
Interquartile 25% (IQ1)83.1%81.4%
Interquartile 75% (IQ3)88.2%87.9%
Interquartile Range (IQR)5.1%6.5%
Standard Deviation (Sample)4.4%7.9%
Standard Deviation (Population)4.4%7.8%

Similar Demographics by In Labor Force | Age 35-44

Demographics Similar to Immigrants from Senegal by In Labor Force | Age 35-44

In terms of in labor force | age 35-44, the demographic groups most similar to Immigrants from Senegal are Immigrants from Kazakhstan (84.4%, a difference of 0.0%), Immigrants from Venezuela (84.4%, a difference of 0.0%), Immigrants from Hungary (84.4%, a difference of 0.010%), Aleut (84.4%, a difference of 0.010%), and Nigerian (84.4%, a difference of 0.010%).
DemographicsRating | RankIn Labor Force | Age 35-44
Immigrants | Taiwan
71.4
/100
|
#152
Good
84.5%
Trinidadians and Tobagonians
69.5
/100
|
#153
Good
84.5%
Iranians
69.4
/100
|
#154
Good
84.5%
Immigrants | Switzerland
65.9
/100
|
#155
Good
84.5%
Immigrants | Israel
64.3
/100
|
#156
Good
84.4%
Immigrants | Austria
63.8
/100
|
#157
Good
84.4%
Jamaicans
62.7
/100
|
#158
Good
84.4%
Immigrants | Senegal
60.4
/100
|
#159
Good
84.4%
Immigrants | Kazakhstan
60.4
/100
|
#160
Good
84.4%
Immigrants | Venezuela
60.0
/100
|
#161
Good
84.4%
Immigrants | Hungary
59.4
/100
|
#162
Average
84.4%
Aleuts
59.1
/100
|
#163
Average
84.4%
Nigerians
58.9
/100
|
#164
Average
84.4%
Venezuelans
58.1
/100
|
#165
Average
84.4%
Alsatians
55.2
/100
|
#166
Average
84.4%

Demographics Similar to Immigrants from Southern Europe by In Labor Force | Age 35-44

In terms of in labor force | age 35-44, the demographic groups most similar to Immigrants from Southern Europe are Immigrants from Belarus (84.8%, a difference of 0.0%), Immigrants from Sweden (84.8%, a difference of 0.0%), Immigrants from Australia (84.8%, a difference of 0.010%), South American (84.8%, a difference of 0.010%), and Haitian (84.8%, a difference of 0.020%).
DemographicsRating | RankIn Labor Force | Age 35-44
Immigrants | Kuwait
96.7
/100
|
#95
Exceptional
84.8%
Cubans
96.6
/100
|
#96
Exceptional
84.8%
Egyptians
96.6
/100
|
#97
Exceptional
84.8%
Indians (Asian)
96.1
/100
|
#98
Exceptional
84.8%
Haitians
96.0
/100
|
#99
Exceptional
84.8%
Immigrants | Czechoslovakia
95.9
/100
|
#100
Exceptional
84.8%
Immigrants | Australia
95.5
/100
|
#101
Exceptional
84.8%
Immigrants | Southern Europe
95.3
/100
|
#102
Exceptional
84.8%
Immigrants | Belarus
95.3
/100
|
#103
Exceptional
84.8%
Immigrants | Sweden
95.2
/100
|
#104
Exceptional
84.8%
South Americans
95.0
/100
|
#105
Exceptional
84.8%
Immigrants | Bahamas
94.8
/100
|
#106
Exceptional
84.8%
Immigrants | Romania
94.7
/100
|
#107
Exceptional
84.8%
Immigrants | Argentina
94.5
/100
|
#108
Exceptional
84.8%
Immigrants | Russia
94.5
/100
|
#109
Exceptional
84.8%