Immigrants from Guyana vs Immigrants from Southern Europe College, Under 1 year
COMPARE
Immigrants from Guyana
Immigrants from Southern Europe
College, Under 1 year
College, Under 1 year Comparison
Immigrants from Guyana
Immigrants from Southern Europe
58.5%
COLLEGE, UNDER 1 YEAR
0.0/ 100
METRIC RATING
300th/ 347
METRIC RANK
64.9%
COLLEGE, UNDER 1 YEAR
34.3/ 100
METRIC RATING
187th/ 347
METRIC RANK
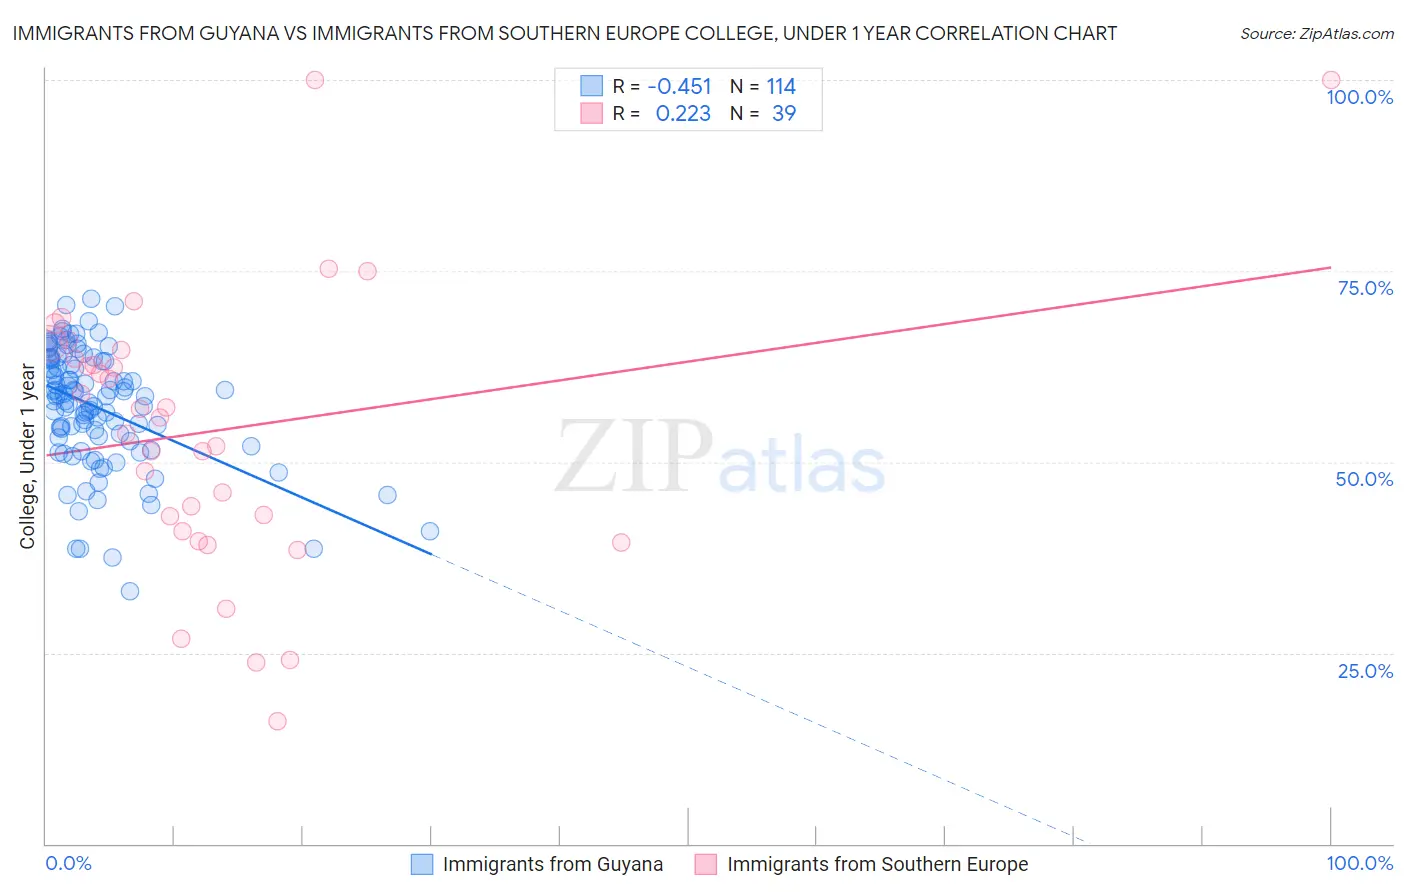
Immigrants from Guyana vs Immigrants from Southern Europe College, Under 1 year Correlation Chart
The statistical analysis conducted on geographies consisting of 183,735,121 people shows a moderate negative correlation between the proportion of Immigrants from Guyana and percentage of population with at least college, under 1 year education in the United States with a correlation coefficient (R) of -0.451 and weighted average of 58.5%. Similarly, the statistical analysis conducted on geographies consisting of 402,801,573 people shows a weak positive correlation between the proportion of Immigrants from Southern Europe and percentage of population with at least college, under 1 year education in the United States with a correlation coefficient (R) of 0.223 and weighted average of 64.9%, a difference of 11.0%.
College, Under 1 year Correlation Summary
| Measurement | Immigrants from Guyana | Immigrants from Southern Europe |
| Minimum | 33.1% | 16.1% |
| Maximum | 71.3% | 100.0% |
| Range | 38.3% | 83.9% |
| Mean | 57.1% | 54.1% |
| Median | 58.5% | 55.8% |
| Interquartile 25% (IQ1) | 52.6% | 40.9% |
| Interquartile 75% (IQ3) | 63.2% | 64.6% |
| Interquartile Range (IQR) | 10.6% | 23.6% |
| Standard Deviation (Sample) | 7.8% | 18.3% |
| Standard Deviation (Population) | 7.8% | 18.1% |
Similar Demographics by College, Under 1 year
Demographics Similar to Immigrants from Guyana by College, Under 1 year
In terms of college, under 1 year, the demographic groups most similar to Immigrants from Guyana are Cuban (58.6%, a difference of 0.26%), Immigrants from Ecuador (58.7%, a difference of 0.39%), Mexican American Indian (58.1%, a difference of 0.62%), Apache (58.0%, a difference of 0.81%), and Guyanese (59.0%, a difference of 0.89%).
| Demographics | Rating | Rank | College, Under 1 year |
| Seminole | 0.0 /100 | #293 | Tragic 59.1% |
| Immigrants | Belize | 0.0 /100 | #294 | Tragic 59.1% |
| Immigrants | Grenada | 0.0 /100 | #295 | Tragic 59.1% |
| Central American Indians | 0.0 /100 | #296 | Tragic 59.0% |
| Guyanese | 0.0 /100 | #297 | Tragic 59.0% |
| Immigrants | Ecuador | 0.0 /100 | #298 | Tragic 58.7% |
| Cubans | 0.0 /100 | #299 | Tragic 58.6% |
| Immigrants | Guyana | 0.0 /100 | #300 | Tragic 58.5% |
| Mexican American Indians | 0.0 /100 | #301 | Tragic 58.1% |
| Apache | 0.0 /100 | #302 | Tragic 58.0% |
| Immigrants | Dominica | 0.0 /100 | #303 | Tragic 57.9% |
| Kiowa | 0.0 /100 | #304 | Tragic 57.8% |
| Haitians | 0.0 /100 | #305 | Tragic 57.8% |
| Immigrants | Portugal | 0.0 /100 | #306 | Tragic 57.7% |
| Fijians | 0.0 /100 | #307 | Tragic 57.7% |
Demographics Similar to Immigrants from Southern Europe by College, Under 1 year
In terms of college, under 1 year, the demographic groups most similar to Immigrants from Southern Europe are Immigrants from Albania (64.9%, a difference of 0.11%), Spanish (64.9%, a difference of 0.14%), Immigrants from Philippines (64.8%, a difference of 0.21%), Immigrants from Sierra Leone (65.1%, a difference of 0.26%), and Immigrants from Armenia (64.7%, a difference of 0.32%).
| Demographics | Rating | Rank | College, Under 1 year |
| Dutch | 46.1 /100 | #180 | Average 65.3% |
| Spaniards | 45.5 /100 | #181 | Average 65.3% |
| Immigrants | Africa | 44.7 /100 | #182 | Average 65.3% |
| Immigrants | Poland | 42.6 /100 | #183 | Average 65.2% |
| Bermudans | 42.0 /100 | #184 | Average 65.2% |
| Sri Lankans | 41.7 /100 | #185 | Average 65.2% |
| Immigrants | Sierra Leone | 39.7 /100 | #186 | Fair 65.1% |
| Immigrants | Southern Europe | 34.3 /100 | #187 | Fair 64.9% |
| Immigrants | Albania | 32.0 /100 | #188 | Fair 64.9% |
| Spanish | 31.6 /100 | #189 | Fair 64.9% |
| Immigrants | Philippines | 30.1 /100 | #190 | Fair 64.8% |
| Immigrants | Armenia | 28.1 /100 | #191 | Fair 64.7% |
| Immigrants | Thailand | 27.0 /100 | #192 | Fair 64.7% |
| Slovaks | 26.7 /100 | #193 | Fair 64.7% |
| Immigrants | Cameroon | 24.6 /100 | #194 | Fair 64.6% |