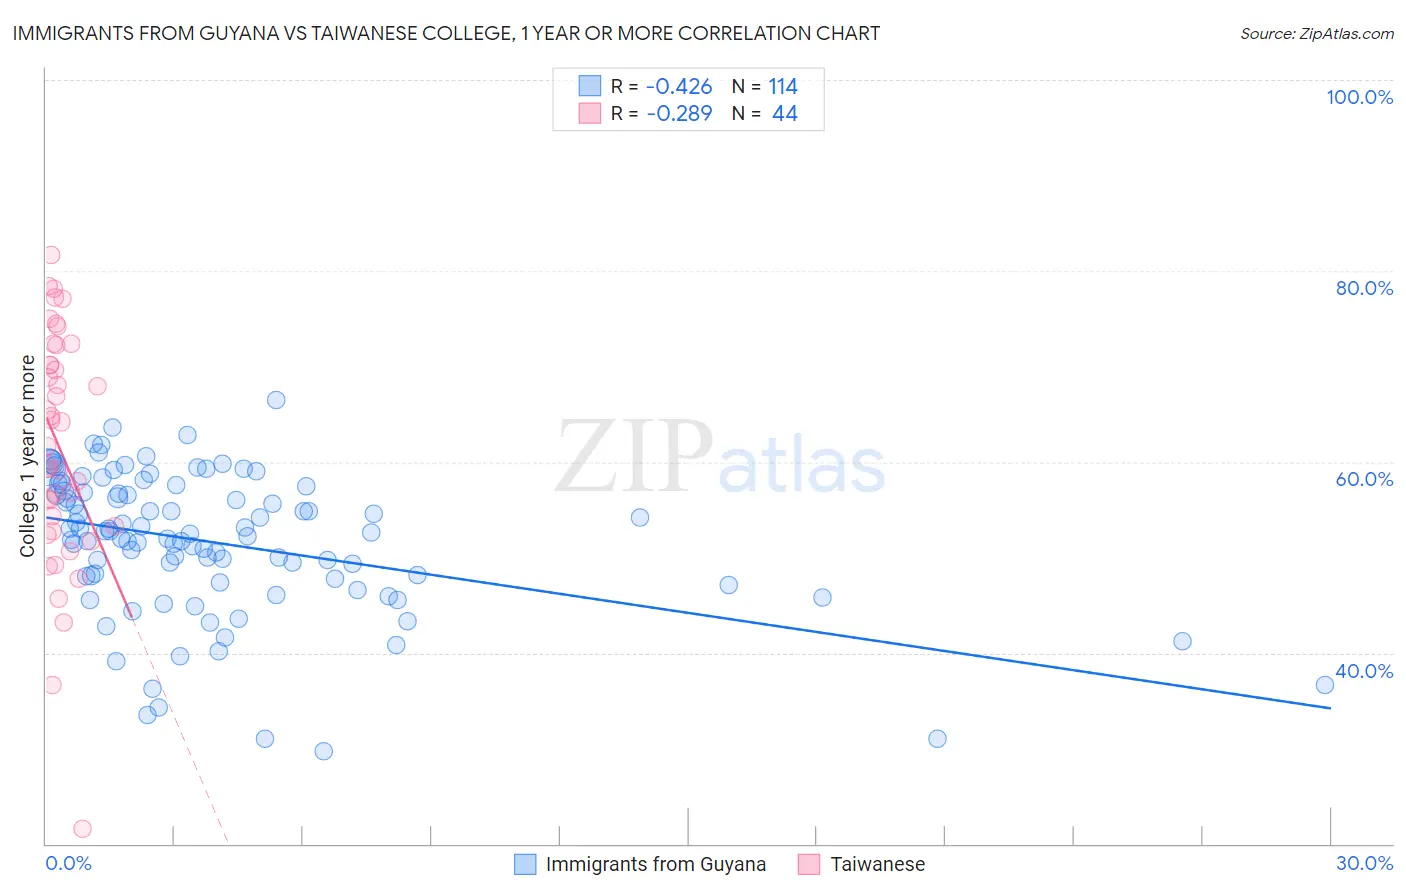
Immigrants from Guyana vs Taiwanese College, 1 year or more
COMPARE
Immigrants from Guyana
Taiwanese
College, 1 year or more
College, 1 year or more Comparison
Immigrants from Guyana
Taiwanese
53.5%
COLLEGE, 1 YEAR OR MORE
0.1/ 100
METRIC RATING
285th/ 347
METRIC RANK
60.7%
COLLEGE, 1 YEAR OR MORE
84.3/ 100
METRIC RATING
138th/ 347
METRIC RANK
Immigrants from Guyana vs Taiwanese College, 1 year or more Correlation Chart
The statistical analysis conducted on geographies consisting of 183,735,121 people shows a moderate negative correlation between the proportion of Immigrants from Guyana and percentage of population with at least college, 1 year or more education in the United States with a correlation coefficient (R) of -0.426 and weighted average of 53.5%. Similarly, the statistical analysis conducted on geographies consisting of 31,724,936 people shows a weak negative correlation between the proportion of Taiwanese and percentage of population with at least college, 1 year or more education in the United States with a correlation coefficient (R) of -0.289 and weighted average of 60.7%, a difference of 13.4%.
College, 1 year or more Correlation Summary
| Measurement | Immigrants from Guyana | Taiwanese |
| Minimum | 29.6% | 21.6% |
| Maximum | 66.5% | 81.7% |
| Range | 36.8% | 60.1% |
| Mean | 51.5% | 61.5% |
| Median | 52.6% | 62.9% |
| Interquartile 25% (IQ1) | 47.8% | 53.0% |
| Interquartile 75% (IQ3) | 57.0% | 71.2% |
| Interquartile Range (IQR) | 9.2% | 18.2% |
| Standard Deviation (Sample) | 7.4% | 12.5% |
| Standard Deviation (Population) | 7.4% | 12.3% |
Similar Demographics by College, 1 year or more
Demographics Similar to Immigrants from Guyana by College, 1 year or more
In terms of college, 1 year or more, the demographic groups most similar to Immigrants from Guyana are Central American Indian (53.5%, a difference of 0.040%), Immigrants from Belize (53.5%, a difference of 0.080%), Alaska Native (53.4%, a difference of 0.25%), Immigrants from Ecuador (53.4%, a difference of 0.25%), and Alaskan Athabascan (53.4%, a difference of 0.27%).
| Demographics | Rating | Rank | College, 1 year or more |
| Immigrants | Jamaica | 0.1 /100 | #278 | Tragic 54.2% |
| Arapaho | 0.1 /100 | #279 | Tragic 54.1% |
| Cheyenne | 0.1 /100 | #280 | Tragic 54.1% |
| Colville | 0.1 /100 | #281 | Tragic 54.1% |
| Guyanese | 0.1 /100 | #282 | Tragic 54.1% |
| Nicaraguans | 0.1 /100 | #283 | Tragic 53.9% |
| Ute | 0.1 /100 | #284 | Tragic 53.8% |
| Immigrants | Guyana | 0.1 /100 | #285 | Tragic 53.5% |
| Central American Indians | 0.1 /100 | #286 | Tragic 53.5% |
| Immigrants | Belize | 0.1 /100 | #287 | Tragic 53.5% |
| Alaska Natives | 0.0 /100 | #288 | Tragic 53.4% |
| Immigrants | Ecuador | 0.0 /100 | #289 | Tragic 53.4% |
| Alaskan Athabascans | 0.0 /100 | #290 | Tragic 53.4% |
| Cubans | 0.0 /100 | #291 | Tragic 53.4% |
| Chickasaw | 0.0 /100 | #292 | Tragic 53.3% |
Demographics Similar to Taiwanese by College, 1 year or more
In terms of college, 1 year or more, the demographic groups most similar to Taiwanese are Immigrants from Eritrea (60.7%, a difference of 0.0%), Iraqi (60.7%, a difference of 0.10%), Immigrants from Afghanistan (60.7%, a difference of 0.11%), Polish (60.7%, a difference of 0.15%), and Canadian (60.6%, a difference of 0.15%).
| Demographics | Rating | Rank | College, 1 year or more |
| Immigrants | Morocco | 89.5 /100 | #131 | Excellent 61.1% |
| Scandinavians | 88.2 /100 | #132 | Excellent 61.0% |
| Immigrants | Uzbekistan | 88.0 /100 | #133 | Excellent 61.0% |
| Immigrants | Venezuela | 87.9 /100 | #134 | Excellent 61.0% |
| Immigrants | Uganda | 87.4 /100 | #135 | Excellent 60.9% |
| Basques | 87.2 /100 | #136 | Excellent 60.9% |
| Slovenes | 86.5 /100 | #137 | Excellent 60.9% |
| Taiwanese | 84.3 /100 | #138 | Excellent 60.7% |
| Immigrants | Eritrea | 84.3 /100 | #139 | Excellent 60.7% |
| Iraqis | 83.3 /100 | #140 | Excellent 60.7% |
| Immigrants | Afghanistan | 83.1 /100 | #141 | Excellent 60.7% |
| Poles | 82.8 /100 | #142 | Excellent 60.7% |
| Canadians | 82.7 /100 | #143 | Excellent 60.6% |
| Czechs | 81.9 /100 | #144 | Excellent 60.6% |
| Slavs | 81.1 /100 | #145 | Excellent 60.6% |