Immigrants from Russia vs Pima College, 1 year or more
COMPARE
Immigrants from Russia
Pima
College, 1 year or more
College, 1 year or more Comparison
Immigrants from Russia
Pima
64.7%
COLLEGE, 1 YEAR OR MORE
99.9/ 100
METRIC RATING
43rd/ 347
METRIC RANK
45.6%
COLLEGE, 1 YEAR OR MORE
0.0/ 100
METRIC RATING
345th/ 347
METRIC RANK
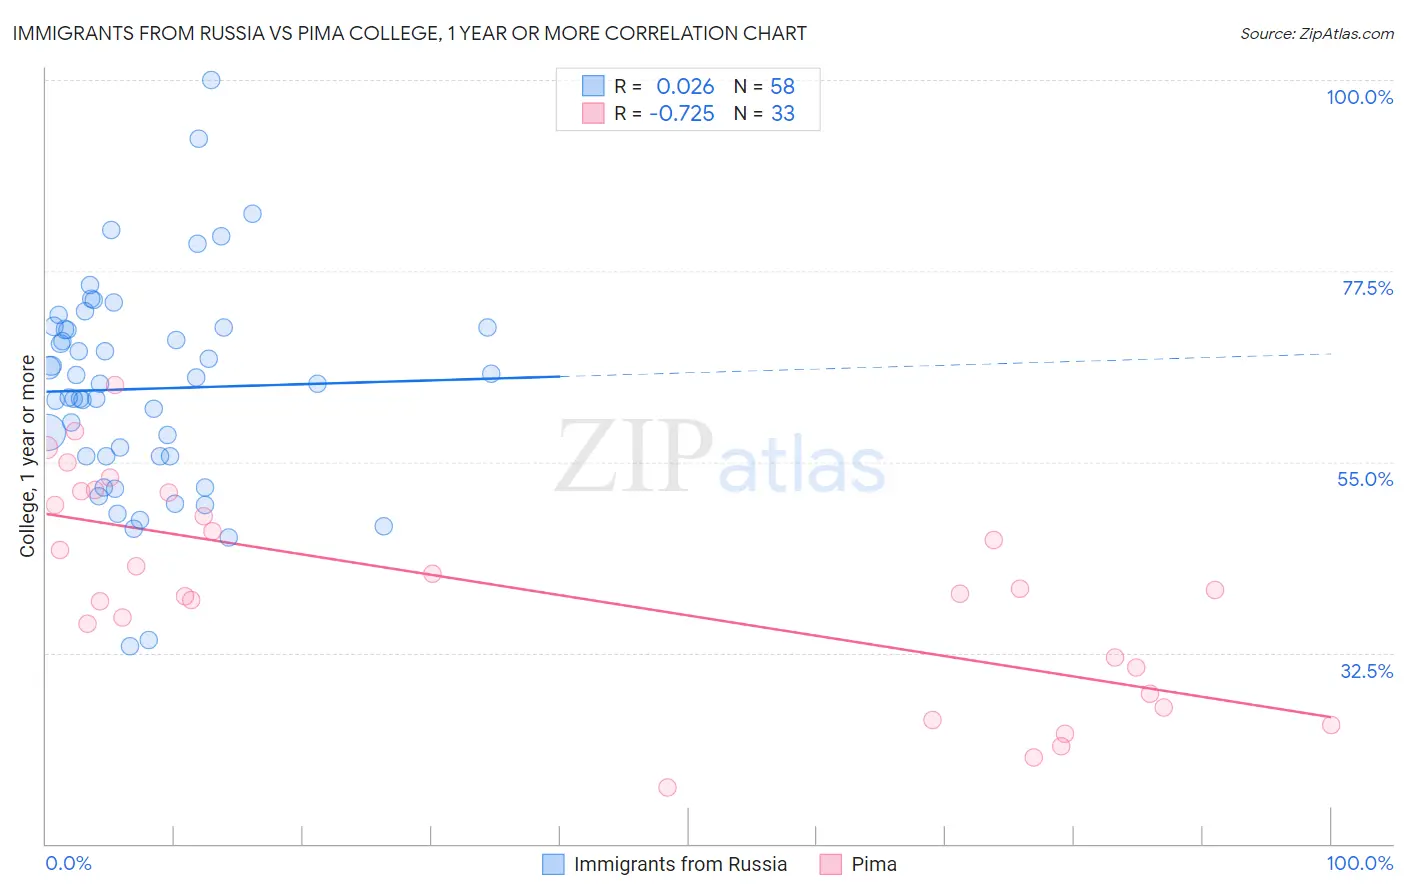
Immigrants from Russia vs Pima College, 1 year or more Correlation Chart
The statistical analysis conducted on geographies consisting of 347,945,922 people shows no correlation between the proportion of Immigrants from Russia and percentage of population with at least college, 1 year or more education in the United States with a correlation coefficient (R) of 0.026 and weighted average of 64.7%. Similarly, the statistical analysis conducted on geographies consisting of 61,552,513 people shows a strong negative correlation between the proportion of Pima and percentage of population with at least college, 1 year or more education in the United States with a correlation coefficient (R) of -0.725 and weighted average of 45.6%, a difference of 41.9%.
College, 1 year or more Correlation Summary
| Measurement | Immigrants from Russia | Pima |
| Minimum | 33.2% | 16.6% |
| Maximum | 100.0% | 64.1% |
| Range | 66.8% | 47.5% |
| Mean | 63.6% | 39.9% |
| Median | 64.2% | 39.9% |
| Interquartile 25% (IQ1) | 55.7% | 29.3% |
| Interquartile 75% (IQ3) | 70.8% | 50.7% |
| Interquartile Range (IQR) | 15.1% | 21.4% |
| Standard Deviation (Sample) | 12.6% | 12.3% |
| Standard Deviation (Population) | 12.5% | 12.2% |
Similar Demographics by College, 1 year or more
Demographics Similar to Immigrants from Russia by College, 1 year or more
In terms of college, 1 year or more, the demographic groups most similar to Immigrants from Russia are Immigrants from Norway (64.7%, a difference of 0.020%), Immigrants from Latvia (64.8%, a difference of 0.12%), Mongolian (64.8%, a difference of 0.13%), Immigrants from Lithuania (64.6%, a difference of 0.19%), and Bhutanese (64.6%, a difference of 0.20%).
| Demographics | Rating | Rank | College, 1 year or more |
| Immigrants | South Africa | 99.9 /100 | #36 | Exceptional 65.1% |
| Russians | 99.9 /100 | #37 | Exceptional 65.1% |
| Immigrants | Saudi Arabia | 99.9 /100 | #38 | Exceptional 65.0% |
| Estonians | 99.9 /100 | #39 | Exceptional 65.0% |
| Immigrants | Kuwait | 99.9 /100 | #40 | Exceptional 65.0% |
| Mongolians | 99.9 /100 | #41 | Exceptional 64.8% |
| Immigrants | Latvia | 99.9 /100 | #42 | Exceptional 64.8% |
| Immigrants | Russia | 99.9 /100 | #43 | Exceptional 64.7% |
| Immigrants | Norway | 99.9 /100 | #44 | Exceptional 64.7% |
| Immigrants | Lithuania | 99.9 /100 | #45 | Exceptional 64.6% |
| Bhutanese | 99.9 /100 | #46 | Exceptional 64.6% |
| Australians | 99.9 /100 | #47 | Exceptional 64.6% |
| Immigrants | Bulgaria | 99.9 /100 | #48 | Exceptional 64.6% |
| New Zealanders | 99.9 /100 | #49 | Exceptional 64.6% |
| Immigrants | Austria | 99.8 /100 | #50 | Exceptional 64.4% |
Demographics Similar to Pima by College, 1 year or more
In terms of college, 1 year or more, the demographic groups most similar to Pima are Yakama (46.2%, a difference of 1.3%), Tohono O'odham (47.1%, a difference of 3.4%), Inupiat (47.2%, a difference of 3.6%), Immigrants from Mexico (47.5%, a difference of 4.2%), and Immigrants from Cabo Verde (48.1%, a difference of 5.4%).
| Demographics | Rating | Rank | College, 1 year or more |
| Immigrants | Dominican Republic | 0.0 /100 | #333 | Tragic 49.1% |
| Lumbee | 0.0 /100 | #334 | Tragic 48.9% |
| Yuman | 0.0 /100 | #335 | Tragic 48.7% |
| Spanish American Indians | 0.0 /100 | #336 | Tragic 48.5% |
| Pennsylvania Germans | 0.0 /100 | #337 | Tragic 48.5% |
| Immigrants | Central America | 0.0 /100 | #338 | Tragic 48.5% |
| Immigrants | Azores | 0.0 /100 | #339 | Tragic 48.4% |
| Immigrants | Cabo Verde | 0.0 /100 | #340 | Tragic 48.1% |
| Immigrants | Mexico | 0.0 /100 | #341 | Tragic 47.5% |
| Inupiat | 0.0 /100 | #342 | Tragic 47.2% |
| Tohono O'odham | 0.0 /100 | #343 | Tragic 47.1% |
| Yakama | 0.0 /100 | #344 | Tragic 46.2% |
| Pima | 0.0 /100 | #345 | Tragic 45.6% |
| Houma | 0.0 /100 | #346 | Tragic 41.2% |
| Yup'ik | 0.0 /100 | #347 | Tragic 39.4% |