Immigrants from Russia vs Argentinean College, 1 year or more
COMPARE
Immigrants from Russia
Argentinean
College, 1 year or more
College, 1 year or more Comparison
Immigrants from Russia
Argentineans
64.7%
COLLEGE, 1 YEAR OR MORE
99.9/ 100
METRIC RATING
43rd/ 347
METRIC RANK
63.2%
COLLEGE, 1 YEAR OR MORE
99.2/ 100
METRIC RATING
70th/ 347
METRIC RANK
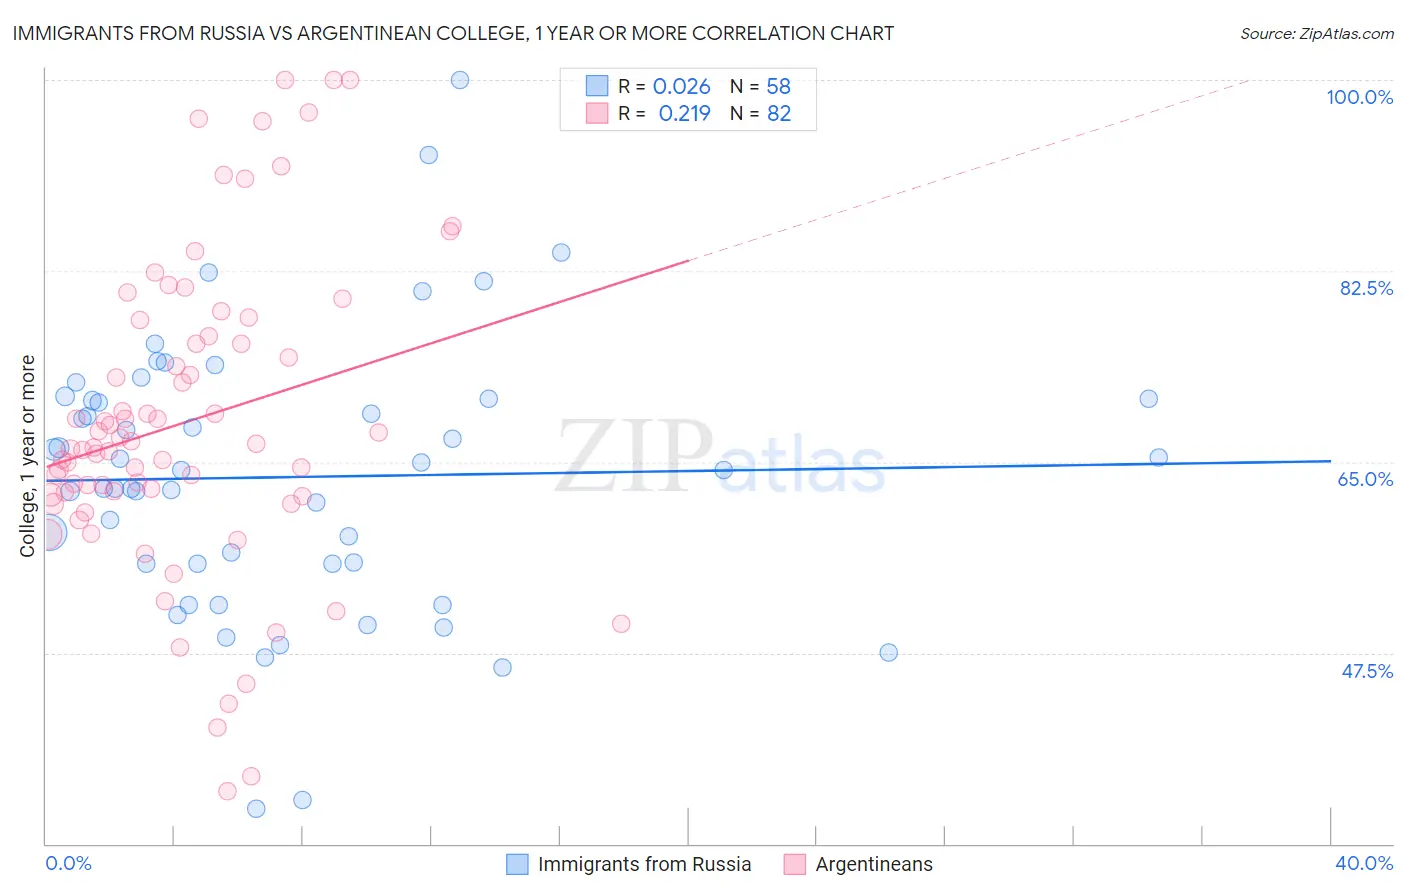
Immigrants from Russia vs Argentinean College, 1 year or more Correlation Chart
The statistical analysis conducted on geographies consisting of 347,945,922 people shows no correlation between the proportion of Immigrants from Russia and percentage of population with at least college, 1 year or more education in the United States with a correlation coefficient (R) of 0.026 and weighted average of 64.7%. Similarly, the statistical analysis conducted on geographies consisting of 297,139,739 people shows a weak positive correlation between the proportion of Argentineans and percentage of population with at least college, 1 year or more education in the United States with a correlation coefficient (R) of 0.219 and weighted average of 63.2%, a difference of 2.4%.
College, 1 year or more Correlation Summary
| Measurement | Immigrants from Russia | Argentinean |
| Minimum | 33.2% | 34.8% |
| Maximum | 100.0% | 100.0% |
| Range | 66.8% | 65.2% |
| Mean | 63.6% | 68.7% |
| Median | 64.2% | 66.5% |
| Interquartile 25% (IQ1) | 55.7% | 62.0% |
| Interquartile 75% (IQ3) | 70.8% | 76.5% |
| Interquartile Range (IQR) | 15.1% | 14.6% |
| Standard Deviation (Sample) | 12.6% | 14.2% |
| Standard Deviation (Population) | 12.5% | 14.2% |
Similar Demographics by College, 1 year or more
Demographics Similar to Immigrants from Russia by College, 1 year or more
In terms of college, 1 year or more, the demographic groups most similar to Immigrants from Russia are Immigrants from Norway (64.7%, a difference of 0.020%), Immigrants from Latvia (64.8%, a difference of 0.12%), Mongolian (64.8%, a difference of 0.13%), Immigrants from Lithuania (64.6%, a difference of 0.19%), and Bhutanese (64.6%, a difference of 0.20%).
| Demographics | Rating | Rank | College, 1 year or more |
| Immigrants | South Africa | 99.9 /100 | #36 | Exceptional 65.1% |
| Russians | 99.9 /100 | #37 | Exceptional 65.1% |
| Immigrants | Saudi Arabia | 99.9 /100 | #38 | Exceptional 65.0% |
| Estonians | 99.9 /100 | #39 | Exceptional 65.0% |
| Immigrants | Kuwait | 99.9 /100 | #40 | Exceptional 65.0% |
| Mongolians | 99.9 /100 | #41 | Exceptional 64.8% |
| Immigrants | Latvia | 99.9 /100 | #42 | Exceptional 64.8% |
| Immigrants | Russia | 99.9 /100 | #43 | Exceptional 64.7% |
| Immigrants | Norway | 99.9 /100 | #44 | Exceptional 64.7% |
| Immigrants | Lithuania | 99.9 /100 | #45 | Exceptional 64.6% |
| Bhutanese | 99.9 /100 | #46 | Exceptional 64.6% |
| Australians | 99.9 /100 | #47 | Exceptional 64.6% |
| Immigrants | Bulgaria | 99.9 /100 | #48 | Exceptional 64.6% |
| New Zealanders | 99.9 /100 | #49 | Exceptional 64.6% |
| Immigrants | Austria | 99.8 /100 | #50 | Exceptional 64.4% |
Demographics Similar to Argentineans by College, 1 year or more
In terms of college, 1 year or more, the demographic groups most similar to Argentineans are Immigrants from Greece (63.3%, a difference of 0.10%), Immigrants from Zimbabwe (63.3%, a difference of 0.10%), Immigrants from Romania (63.3%, a difference of 0.12%), Immigrants from Europe (63.3%, a difference of 0.13%), and Immigrants from Canada (63.1%, a difference of 0.18%).
| Demographics | Rating | Rank | College, 1 year or more |
| Immigrants | Scotland | 99.4 /100 | #63 | Exceptional 63.4% |
| Immigrants | Spain | 99.4 /100 | #64 | Exceptional 63.4% |
| Maltese | 99.3 /100 | #65 | Exceptional 63.4% |
| Immigrants | Europe | 99.3 /100 | #66 | Exceptional 63.3% |
| Immigrants | Romania | 99.3 /100 | #67 | Exceptional 63.3% |
| Immigrants | Greece | 99.3 /100 | #68 | Exceptional 63.3% |
| Immigrants | Zimbabwe | 99.3 /100 | #69 | Exceptional 63.3% |
| Argentineans | 99.2 /100 | #70 | Exceptional 63.2% |
| Immigrants | Canada | 99.1 /100 | #71 | Exceptional 63.1% |
| Egyptians | 99.0 /100 | #72 | Exceptional 63.1% |
| Immigrants | Moldova | 99.0 /100 | #73 | Exceptional 63.0% |
| Immigrants | North America | 99.0 /100 | #74 | Exceptional 63.0% |
| Armenians | 98.9 /100 | #75 | Exceptional 63.0% |
| Paraguayans | 98.8 /100 | #76 | Exceptional 62.9% |
| Ethiopians | 98.8 /100 | #77 | Exceptional 62.9% |