Immigrants from Russia vs Nepalese College, 1 year or more
COMPARE
Immigrants from Russia
Nepalese
College, 1 year or more
College, 1 year or more Comparison
Immigrants from Russia
Nepalese
64.7%
COLLEGE, 1 YEAR OR MORE
99.9/ 100
METRIC RATING
43rd/ 347
METRIC RANK
54.9%
COLLEGE, 1 YEAR OR MORE
0.3/ 100
METRIC RATING
259th/ 347
METRIC RANK
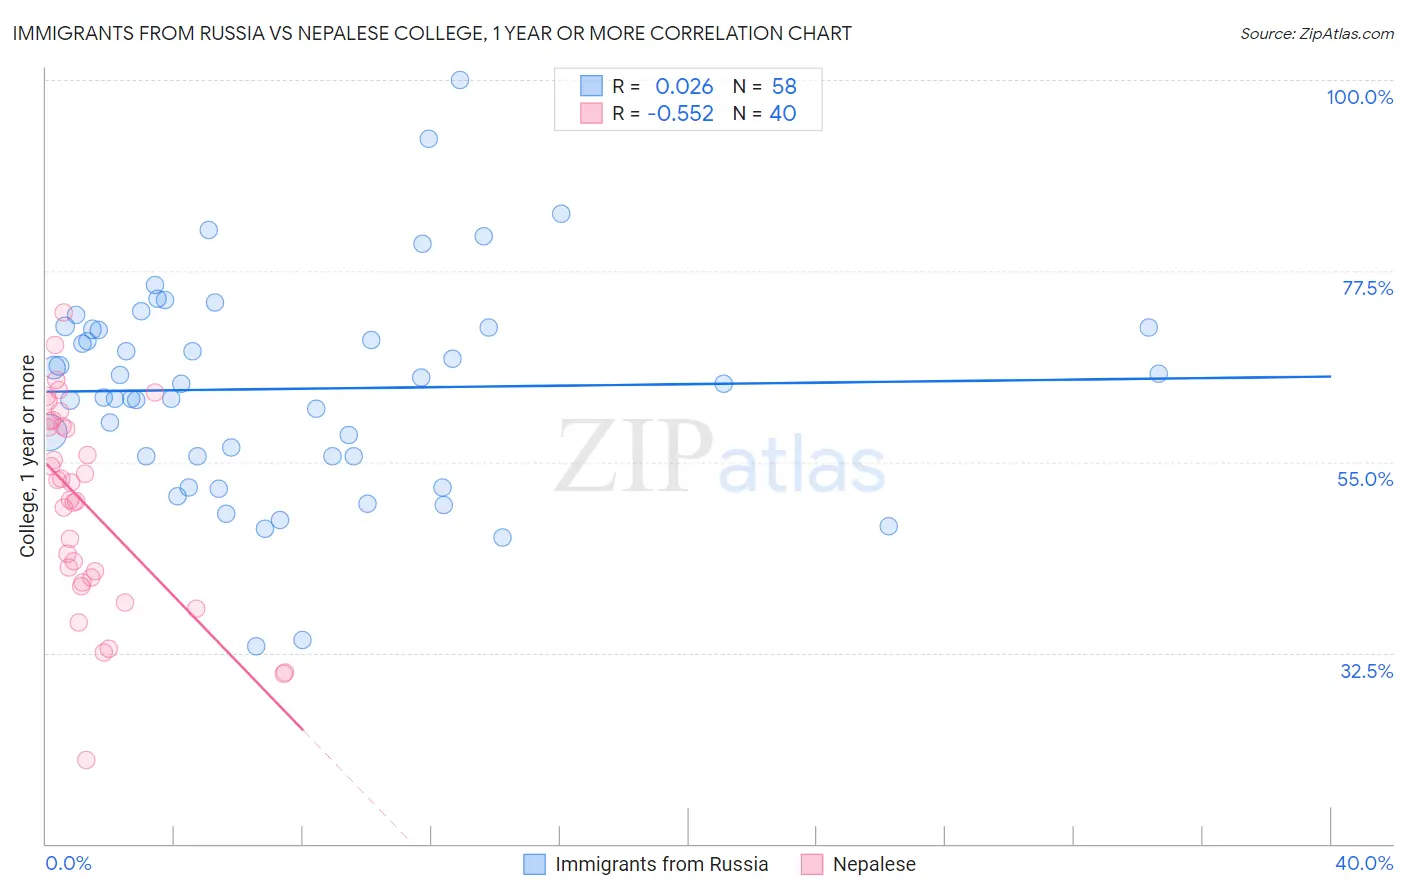
Immigrants from Russia vs Nepalese College, 1 year or more Correlation Chart
The statistical analysis conducted on geographies consisting of 347,945,922 people shows no correlation between the proportion of Immigrants from Russia and percentage of population with at least college, 1 year or more education in the United States with a correlation coefficient (R) of 0.026 and weighted average of 64.7%. Similarly, the statistical analysis conducted on geographies consisting of 24,521,755 people shows a substantial negative correlation between the proportion of Nepalese and percentage of population with at least college, 1 year or more education in the United States with a correlation coefficient (R) of -0.552 and weighted average of 54.9%, a difference of 17.9%.
College, 1 year or more Correlation Summary
| Measurement | Immigrants from Russia | Nepalese |
| Minimum | 33.2% | 19.8% |
| Maximum | 100.0% | 72.6% |
| Range | 66.8% | 52.8% |
| Mean | 63.6% | 49.8% |
| Median | 64.2% | 51.5% |
| Interquartile 25% (IQ1) | 55.7% | 41.1% |
| Interquartile 75% (IQ3) | 70.8% | 59.5% |
| Interquartile Range (IQR) | 15.1% | 18.5% |
| Standard Deviation (Sample) | 12.6% | 12.1% |
| Standard Deviation (Population) | 12.5% | 11.9% |
Similar Demographics by College, 1 year or more
Demographics Similar to Immigrants from Russia by College, 1 year or more
In terms of college, 1 year or more, the demographic groups most similar to Immigrants from Russia are Immigrants from Norway (64.7%, a difference of 0.020%), Immigrants from Latvia (64.8%, a difference of 0.12%), Mongolian (64.8%, a difference of 0.13%), Immigrants from Lithuania (64.6%, a difference of 0.19%), and Bhutanese (64.6%, a difference of 0.20%).
| Demographics | Rating | Rank | College, 1 year or more |
| Immigrants | South Africa | 99.9 /100 | #36 | Exceptional 65.1% |
| Russians | 99.9 /100 | #37 | Exceptional 65.1% |
| Immigrants | Saudi Arabia | 99.9 /100 | #38 | Exceptional 65.0% |
| Estonians | 99.9 /100 | #39 | Exceptional 65.0% |
| Immigrants | Kuwait | 99.9 /100 | #40 | Exceptional 65.0% |
| Mongolians | 99.9 /100 | #41 | Exceptional 64.8% |
| Immigrants | Latvia | 99.9 /100 | #42 | Exceptional 64.8% |
| Immigrants | Russia | 99.9 /100 | #43 | Exceptional 64.7% |
| Immigrants | Norway | 99.9 /100 | #44 | Exceptional 64.7% |
| Immigrants | Lithuania | 99.9 /100 | #45 | Exceptional 64.6% |
| Bhutanese | 99.9 /100 | #46 | Exceptional 64.6% |
| Australians | 99.9 /100 | #47 | Exceptional 64.6% |
| Immigrants | Bulgaria | 99.9 /100 | #48 | Exceptional 64.6% |
| New Zealanders | 99.9 /100 | #49 | Exceptional 64.6% |
| Immigrants | Austria | 99.8 /100 | #50 | Exceptional 64.4% |
Demographics Similar to Nepalese by College, 1 year or more
In terms of college, 1 year or more, the demographic groups most similar to Nepalese are African (55.0%, a difference of 0.060%), Jamaican (54.9%, a difference of 0.10%), Ottawa (54.9%, a difference of 0.13%), Immigrants from St. Vincent and the Grenadines (54.8%, a difference of 0.21%), and U.S. Virgin Islander (54.8%, a difference of 0.24%).
| Demographics | Rating | Rank | College, 1 year or more |
| Aleuts | 0.6 /100 | #252 | Tragic 55.4% |
| Immigrants | Barbados | 0.6 /100 | #253 | Tragic 55.4% |
| Japanese | 0.5 /100 | #254 | Tragic 55.2% |
| Immigrants | Bahamas | 0.5 /100 | #255 | Tragic 55.2% |
| Immigrants | West Indies | 0.5 /100 | #256 | Tragic 55.2% |
| Indonesians | 0.4 /100 | #257 | Tragic 55.1% |
| Africans | 0.4 /100 | #258 | Tragic 55.0% |
| Nepalese | 0.3 /100 | #259 | Tragic 54.9% |
| Jamaicans | 0.3 /100 | #260 | Tragic 54.9% |
| Ottawa | 0.3 /100 | #261 | Tragic 54.9% |
| Immigrants | St. Vincent and the Grenadines | 0.3 /100 | #262 | Tragic 54.8% |
| U.S. Virgin Islanders | 0.3 /100 | #263 | Tragic 54.8% |
| Immigrants | Micronesia | 0.3 /100 | #264 | Tragic 54.8% |
| Immigrants | Laos | 0.2 /100 | #265 | Tragic 54.7% |
| Potawatomi | 0.2 /100 | #266 | Tragic 54.6% |