Immigrants from Romania vs Ute 5th Grade
COMPARE
Immigrants from Romania
Ute
5th Grade
5th Grade Comparison
Immigrants from Romania
Ute
97.6%
5TH GRADE
91.6/ 100
METRIC RATING
130th/ 347
METRIC RANK
97.4%
5TH GRADE
74.9/ 100
METRIC RATING
152nd/ 347
METRIC RANK
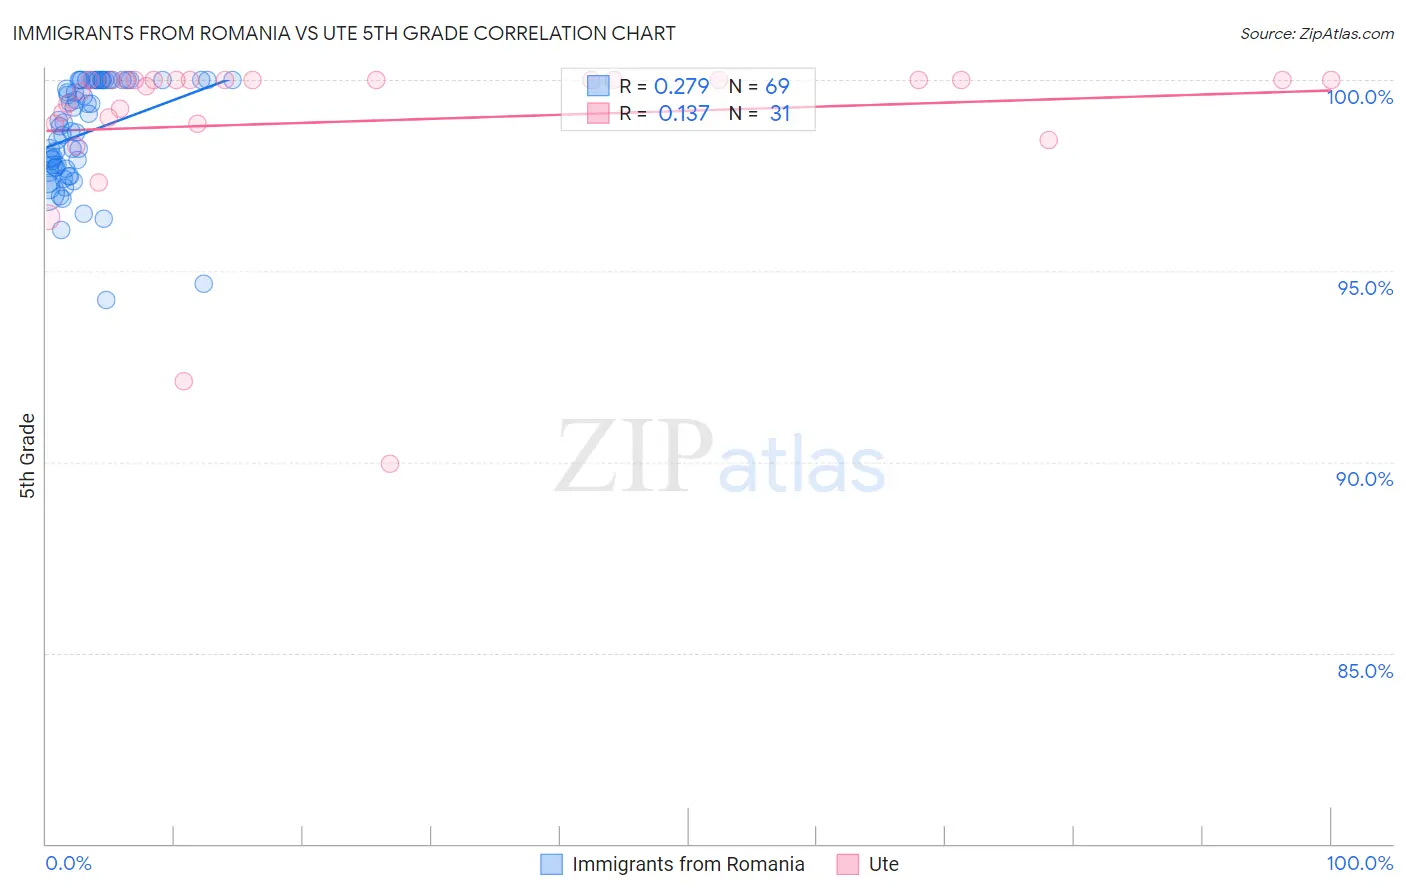
Immigrants from Romania vs Ute 5th Grade Correlation Chart
The statistical analysis conducted on geographies consisting of 257,008,799 people shows a weak positive correlation between the proportion of Immigrants from Romania and percentage of population with at least 5th grade education in the United States with a correlation coefficient (R) of 0.279 and weighted average of 97.6%. Similarly, the statistical analysis conducted on geographies consisting of 55,668,539 people shows a poor positive correlation between the proportion of Ute and percentage of population with at least 5th grade education in the United States with a correlation coefficient (R) of 0.137 and weighted average of 97.4%, a difference of 0.13%.
5th Grade Correlation Summary
| Measurement | Immigrants from Romania | Ute |
| Minimum | 94.3% | 89.9% |
| Maximum | 100.0% | 100.0% |
| Range | 5.7% | 10.1% |
| Mean | 98.6% | 98.9% |
| Median | 98.8% | 100.0% |
| Interquartile 25% (IQ1) | 97.7% | 98.9% |
| Interquartile 75% (IQ3) | 100.0% | 100.0% |
| Interquartile Range (IQR) | 2.3% | 1.1% |
| Standard Deviation (Sample) | 1.4% | 2.3% |
| Standard Deviation (Population) | 1.4% | 2.3% |
Similar Demographics by 5th Grade
Demographics Similar to Immigrants from Romania by 5th Grade
In terms of 5th grade, the demographic groups most similar to Immigrants from Romania are Immigrants from Europe (97.6%, a difference of 0.0%), Hmong (97.6%, a difference of 0.010%), Immigrants from Serbia (97.6%, a difference of 0.010%), Colville (97.6%, a difference of 0.010%), and Pima (97.6%, a difference of 0.010%).
| Demographics | Rating | Rank | 5th Grade |
| Immigrants | Norway | 94.6 /100 | #123 | Exceptional 97.6% |
| Spanish | 93.7 /100 | #124 | Exceptional 97.6% |
| Immigrants | Bulgaria | 93.1 /100 | #125 | Exceptional 97.6% |
| Hmong | 92.3 /100 | #126 | Exceptional 97.6% |
| Immigrants | Serbia | 92.3 /100 | #127 | Exceptional 97.6% |
| Colville | 92.0 /100 | #128 | Exceptional 97.6% |
| Immigrants | Europe | 91.9 /100 | #129 | Exceptional 97.6% |
| Immigrants | Romania | 91.6 /100 | #130 | Exceptional 97.6% |
| Pima | 91.2 /100 | #131 | Exceptional 97.6% |
| Immigrants | Kuwait | 90.4 /100 | #132 | Exceptional 97.6% |
| Cambodians | 90.2 /100 | #133 | Exceptional 97.6% |
| Immigrants | Hungary | 90.1 /100 | #134 | Exceptional 97.6% |
| Palestinians | 89.3 /100 | #135 | Excellent 97.5% |
| Immigrants | Moldova | 87.5 /100 | #136 | Excellent 97.5% |
| Filipinos | 86.8 /100 | #137 | Excellent 97.5% |
Demographics Similar to Ute by 5th Grade
In terms of 5th grade, the demographic groups most similar to Ute are Immigrants from Eastern Europe (97.4%, a difference of 0.0%), Alsatian (97.4%, a difference of 0.0%), Immigrants from Israel (97.5%, a difference of 0.020%), Hopi (97.5%, a difference of 0.020%), and Immigrants from South Central Asia (97.5%, a difference of 0.020%).
| Demographics | Rating | Rank | 5th Grade |
| Jordanians | 82.6 /100 | #145 | Excellent 97.5% |
| Spaniards | 81.9 /100 | #146 | Excellent 97.5% |
| Soviet Union | 81.2 /100 | #147 | Excellent 97.5% |
| Immigrants | Israel | 79.1 /100 | #148 | Good 97.5% |
| Hopi | 78.6 /100 | #149 | Good 97.5% |
| Immigrants | South Central Asia | 78.6 /100 | #150 | Good 97.5% |
| Immigrants | Eastern Europe | 75.0 /100 | #151 | Good 97.4% |
| Ute | 74.9 /100 | #152 | Good 97.4% |
| Alsatians | 74.3 /100 | #153 | Good 97.4% |
| Immigrants | Russia | 71.2 /100 | #154 | Good 97.4% |
| Immigrants | Bosnia and Herzegovina | 71.0 /100 | #155 | Good 97.4% |
| French American Indians | 70.5 /100 | #156 | Good 97.4% |
| Immigrants | Jordan | 70.4 /100 | #157 | Good 97.4% |
| Albanians | 68.3 /100 | #158 | Good 97.4% |
| Immigrants | Italy | 65.2 /100 | #159 | Good 97.4% |