Asian vs Ute 5th Grade
COMPARE
Asian
Ute
5th Grade
5th Grade Comparison
Asians
Ute
96.9%
5TH GRADE
2.0/ 100
METRIC RATING
238th/ 347
METRIC RANK
97.4%
5TH GRADE
74.9/ 100
METRIC RATING
152nd/ 347
METRIC RANK
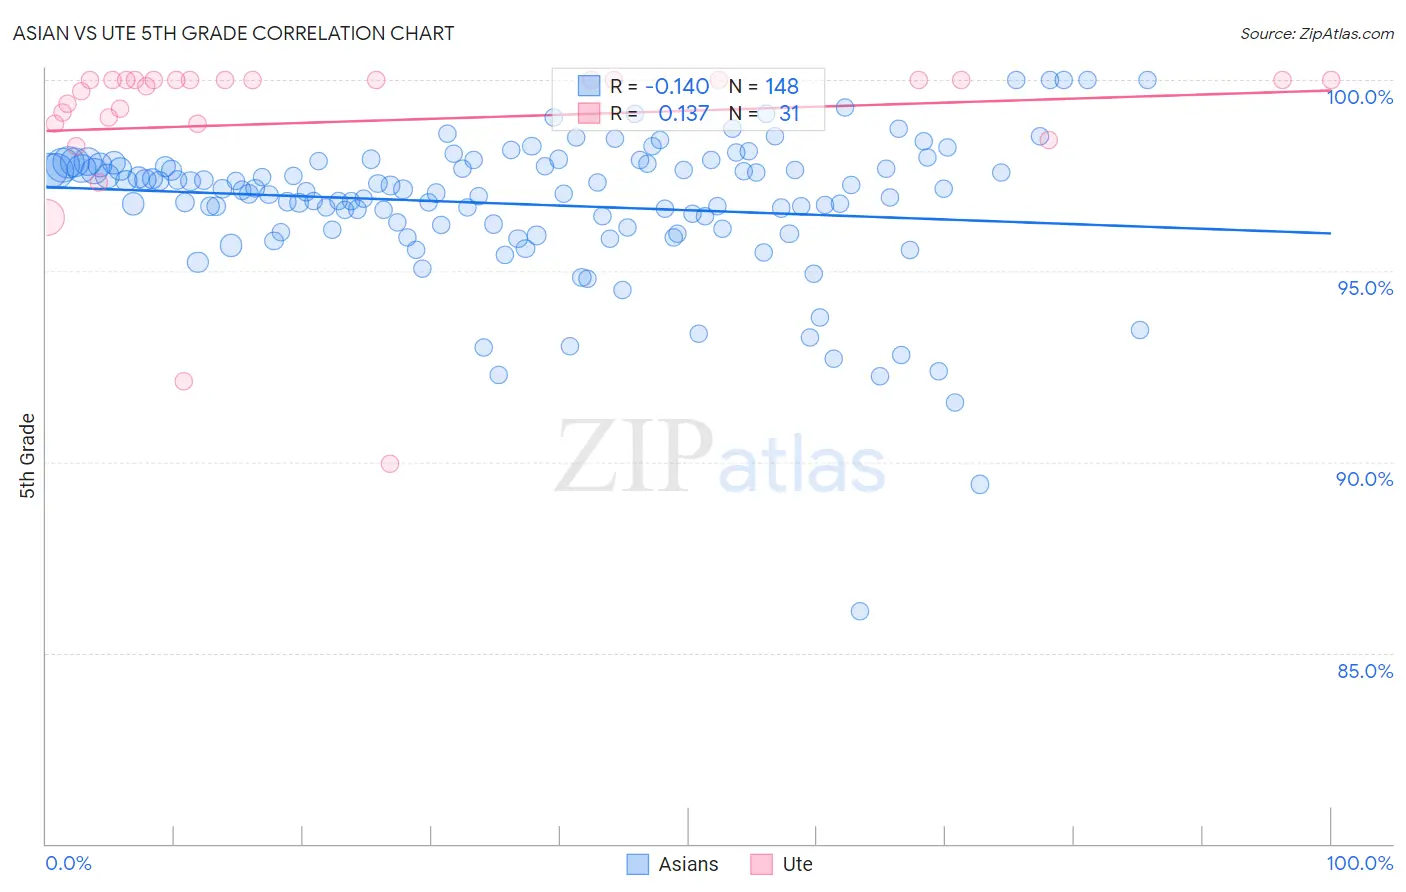
Asian vs Ute 5th Grade Correlation Chart
The statistical analysis conducted on geographies consisting of 550,860,618 people shows a poor negative correlation between the proportion of Asians and percentage of population with at least 5th grade education in the United States with a correlation coefficient (R) of -0.140 and weighted average of 96.9%. Similarly, the statistical analysis conducted on geographies consisting of 55,668,539 people shows a poor positive correlation between the proportion of Ute and percentage of population with at least 5th grade education in the United States with a correlation coefficient (R) of 0.137 and weighted average of 97.4%, a difference of 0.52%.
5th Grade Correlation Summary
| Measurement | Asian | Ute |
| Minimum | 86.1% | 89.9% |
| Maximum | 100.0% | 100.0% |
| Range | 13.9% | 10.1% |
| Mean | 96.7% | 98.9% |
| Median | 97.1% | 100.0% |
| Interquartile 25% (IQ1) | 96.1% | 98.9% |
| Interquartile 75% (IQ3) | 97.8% | 100.0% |
| Interquartile Range (IQR) | 1.7% | 1.1% |
| Standard Deviation (Sample) | 1.9% | 2.3% |
| Standard Deviation (Population) | 1.9% | 2.3% |
Similar Demographics by 5th Grade
Demographics Similar to Asians by 5th Grade
In terms of 5th grade, the demographic groups most similar to Asians are Immigrants from Indonesia (96.9%, a difference of 0.0%), Nigerian (96.9%, a difference of 0.0%), Indian (Asian) (96.9%, a difference of 0.0%), Immigrants from Asia (96.9%, a difference of 0.020%), and Immigrants from Costa Rica (96.9%, a difference of 0.020%).
| Demographics | Rating | Rank | 5th Grade |
| Immigrants | Malaysia | 4.1 /100 | #231 | Tragic 97.0% |
| Immigrants | Eastern Asia | 4.0 /100 | #232 | Tragic 97.0% |
| Sub-Saharan Africans | 3.3 /100 | #233 | Tragic 97.0% |
| Tohono O'odham | 3.2 /100 | #234 | Tragic 97.0% |
| Uruguayans | 3.2 /100 | #235 | Tragic 97.0% |
| Senegalese | 2.8 /100 | #236 | Tragic 97.0% |
| Immigrants | Indonesia | 2.0 /100 | #237 | Tragic 96.9% |
| Asians | 2.0 /100 | #238 | Tragic 96.9% |
| Nigerians | 1.9 /100 | #239 | Tragic 96.9% |
| Indians (Asian) | 1.9 /100 | #240 | Tragic 96.9% |
| Immigrants | Asia | 1.7 /100 | #241 | Tragic 96.9% |
| Immigrants | Costa Rica | 1.6 /100 | #242 | Tragic 96.9% |
| Immigrants | Eastern Africa | 1.6 /100 | #243 | Tragic 96.9% |
| Koreans | 1.6 /100 | #244 | Tragic 96.9% |
| Colombians | 1.3 /100 | #245 | Tragic 96.9% |
Demographics Similar to Ute by 5th Grade
In terms of 5th grade, the demographic groups most similar to Ute are Immigrants from Eastern Europe (97.4%, a difference of 0.0%), Alsatian (97.4%, a difference of 0.0%), Immigrants from Israel (97.5%, a difference of 0.020%), Hopi (97.5%, a difference of 0.020%), and Immigrants from South Central Asia (97.5%, a difference of 0.020%).
| Demographics | Rating | Rank | 5th Grade |
| Jordanians | 82.6 /100 | #145 | Excellent 97.5% |
| Spaniards | 81.9 /100 | #146 | Excellent 97.5% |
| Soviet Union | 81.2 /100 | #147 | Excellent 97.5% |
| Immigrants | Israel | 79.1 /100 | #148 | Good 97.5% |
| Hopi | 78.6 /100 | #149 | Good 97.5% |
| Immigrants | South Central Asia | 78.6 /100 | #150 | Good 97.5% |
| Immigrants | Eastern Europe | 75.0 /100 | #151 | Good 97.4% |
| Ute | 74.9 /100 | #152 | Good 97.4% |
| Alsatians | 74.3 /100 | #153 | Good 97.4% |
| Immigrants | Russia | 71.2 /100 | #154 | Good 97.4% |
| Immigrants | Bosnia and Herzegovina | 71.0 /100 | #155 | Good 97.4% |
| French American Indians | 70.5 /100 | #156 | Good 97.4% |
| Immigrants | Jordan | 70.4 /100 | #157 | Good 97.4% |
| Albanians | 68.3 /100 | #158 | Good 97.4% |
| Immigrants | Italy | 65.2 /100 | #159 | Good 97.4% |