Immigrants from Romania vs Ute Unemployment Among Seniors over 65 years
COMPARE
Immigrants from Romania
Ute
Unemployment Among Seniors over 65 years
Unemployment Among Seniors over 65 years Comparison
Immigrants from Romania
Ute
5.1%
UNEMPLOYMENT AMONG SENIORS OVER 65 YEARS
72.4/ 100
METRIC RATING
156th/ 347
METRIC RANK
6.3%
UNEMPLOYMENT AMONG SENIORS OVER 65 YEARS
0.0/ 100
METRIC RATING
340th/ 347
METRIC RANK
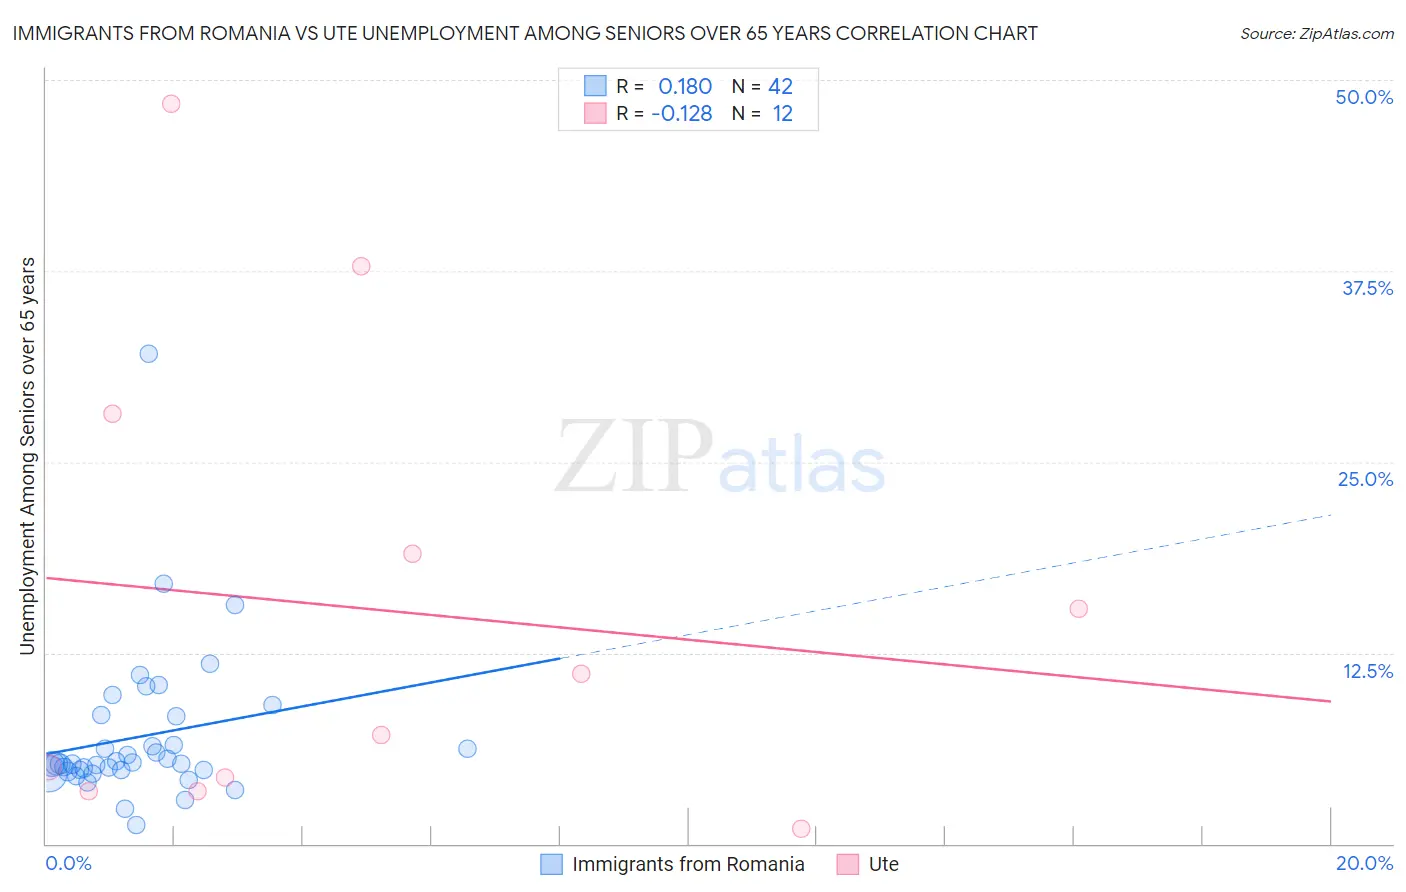
Immigrants from Romania vs Ute Unemployment Among Seniors over 65 years Correlation Chart
The statistical analysis conducted on geographies consisting of 242,736,700 people shows a poor positive correlation between the proportion of Immigrants from Romania and unemployment rate amomg seniors over the age of 65 in the United States with a correlation coefficient (R) of 0.180 and weighted average of 5.1%. Similarly, the statistical analysis conducted on geographies consisting of 53,343,096 people shows a poor negative correlation between the proportion of Ute and unemployment rate amomg seniors over the age of 65 in the United States with a correlation coefficient (R) of -0.128 and weighted average of 6.3%, a difference of 24.0%.
Unemployment Among Seniors over 65 years Correlation Summary
| Measurement | Immigrants from Romania | Ute |
| Minimum | 1.2% | 1.0% |
| Maximum | 32.1% | 48.4% |
| Range | 30.9% | 47.4% |
| Mean | 7.0% | 15.4% |
| Median | 5.2% | 9.1% |
| Interquartile 25% (IQ1) | 4.8% | 3.9% |
| Interquartile 75% (IQ3) | 8.3% | 23.6% |
| Interquartile Range (IQR) | 3.5% | 19.7% |
| Standard Deviation (Sample) | 5.1% | 15.3% |
| Standard Deviation (Population) | 5.0% | 14.7% |
Similar Demographics by Unemployment Among Seniors over 65 years
Demographics Similar to Immigrants from Romania by Unemployment Among Seniors over 65 years
In terms of unemployment among seniors over 65 years, the demographic groups most similar to Immigrants from Romania are Basque (5.1%, a difference of 0.020%), Immigrants from Hong Kong (5.1%, a difference of 0.070%), Immigrants from Czechoslovakia (5.1%, a difference of 0.090%), Canadian (5.1%, a difference of 0.10%), and Immigrants from Northern Europe (5.1%, a difference of 0.10%).
| Demographics | Rating | Rank | Unemployment Among Seniors over 65 years |
| Immigrants | Afghanistan | 76.8 /100 | #149 | Good 5.1% |
| Immigrants | Asia | 75.6 /100 | #150 | Good 5.1% |
| Pakistanis | 75.5 /100 | #151 | Good 5.1% |
| Canadians | 74.7 /100 | #152 | Good 5.1% |
| Immigrants | Czechoslovakia | 74.5 /100 | #153 | Good 5.1% |
| Immigrants | Hong Kong | 74.0 /100 | #154 | Good 5.1% |
| Basques | 72.9 /100 | #155 | Good 5.1% |
| Immigrants | Romania | 72.4 /100 | #156 | Good 5.1% |
| Immigrants | Northern Europe | 69.8 /100 | #157 | Good 5.1% |
| Immigrants | Belarus | 69.0 /100 | #158 | Good 5.1% |
| Immigrants | France | 68.6 /100 | #159 | Good 5.1% |
| French | 68.1 /100 | #160 | Good 5.1% |
| Immigrants | Bosnia and Herzegovina | 66.1 /100 | #161 | Good 5.1% |
| Immigrants | South Eastern Asia | 65.6 /100 | #162 | Good 5.1% |
| Potawatomi | 64.5 /100 | #163 | Good 5.1% |
Demographics Similar to Ute by Unemployment Among Seniors over 65 years
In terms of unemployment among seniors over 65 years, the demographic groups most similar to Ute are Paiute (6.3%, a difference of 0.060%), Immigrants from the Azores (6.3%, a difference of 0.33%), Alaska Native (6.3%, a difference of 0.50%), Pima (6.3%, a difference of 1.1%), and Immigrants from Armenia (6.2%, a difference of 2.9%).
| Demographics | Rating | Rank | Unemployment Among Seniors over 65 years |
| Immigrants | Dominican Republic | 0.0 /100 | #333 | Tragic 6.0% |
| Tohono O'odham | 0.0 /100 | #334 | Tragic 6.1% |
| Immigrants | Armenia | 0.0 /100 | #335 | Tragic 6.2% |
| Pima | 0.0 /100 | #336 | Tragic 6.3% |
| Alaska Natives | 0.0 /100 | #337 | Tragic 6.3% |
| Immigrants | Azores | 0.0 /100 | #338 | Tragic 6.3% |
| Paiute | 0.0 /100 | #339 | Tragic 6.3% |
| Ute | 0.0 /100 | #340 | Tragic 6.3% |
| Yakama | 0.0 /100 | #341 | Tragic 6.7% |
| Navajo | 0.0 /100 | #342 | Tragic 6.7% |
| Tlingit-Haida | 0.0 /100 | #343 | Tragic 6.8% |
| Alaskan Athabascans | 0.0 /100 | #344 | Tragic 7.0% |
| Immigrants | Yemen | 0.0 /100 | #345 | Tragic 8.2% |
| Yup'ik | 0.0 /100 | #346 | Tragic 9.1% |
| Crow | 0.0 /100 | #347 | Tragic 16.9% |