Immigrants from Romania vs American 5th Grade
COMPARE
Immigrants from Romania
American
5th Grade
5th Grade Comparison
Immigrants from Romania
Americans
97.6%
5TH GRADE
91.6/ 100
METRIC RATING
130th/ 347
METRIC RANK
97.9%
5TH GRADE
99.7/ 100
METRIC RATING
59th/ 347
METRIC RANK
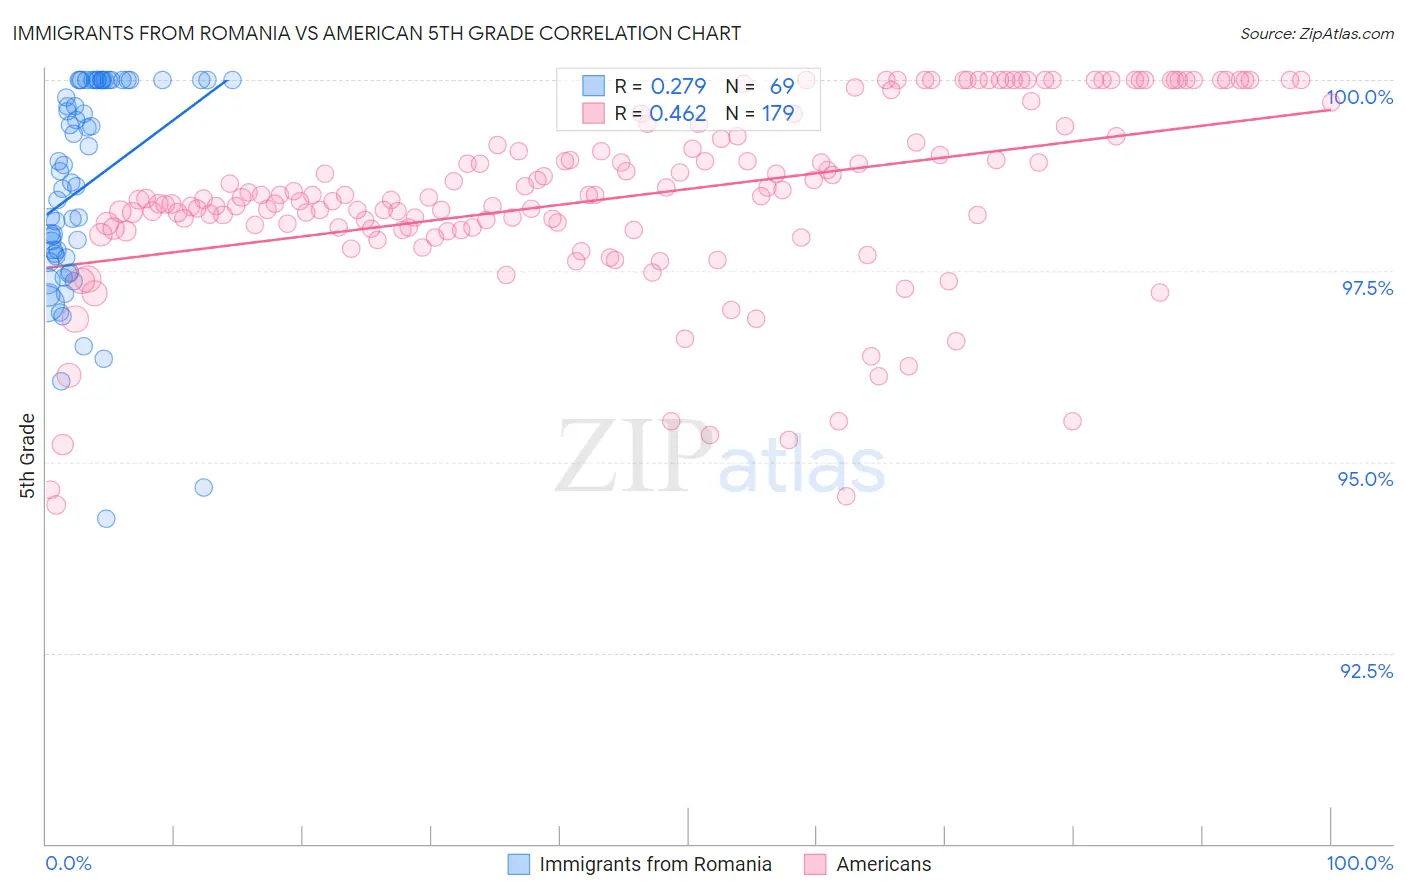
Immigrants from Romania vs American 5th Grade Correlation Chart
The statistical analysis conducted on geographies consisting of 257,008,799 people shows a weak positive correlation between the proportion of Immigrants from Romania and percentage of population with at least 5th grade education in the United States with a correlation coefficient (R) of 0.279 and weighted average of 97.6%. Similarly, the statistical analysis conducted on geographies consisting of 581,993,401 people shows a moderate positive correlation between the proportion of Americans and percentage of population with at least 5th grade education in the United States with a correlation coefficient (R) of 0.462 and weighted average of 97.9%, a difference of 0.37%.
5th Grade Correlation Summary
| Measurement | Immigrants from Romania | American |
| Minimum | 94.3% | 94.4% |
| Maximum | 100.0% | 100.0% |
| Range | 5.7% | 5.6% |
| Mean | 98.6% | 98.5% |
| Median | 98.8% | 98.5% |
| Interquartile 25% (IQ1) | 97.7% | 98.0% |
| Interquartile 75% (IQ3) | 100.0% | 99.3% |
| Interquartile Range (IQR) | 2.3% | 1.2% |
| Standard Deviation (Sample) | 1.4% | 1.2% |
| Standard Deviation (Population) | 1.4% | 1.2% |
Similar Demographics by 5th Grade
Demographics Similar to Immigrants from Romania by 5th Grade
In terms of 5th grade, the demographic groups most similar to Immigrants from Romania are Immigrants from Europe (97.6%, a difference of 0.0%), Hmong (97.6%, a difference of 0.010%), Immigrants from Serbia (97.6%, a difference of 0.010%), Colville (97.6%, a difference of 0.010%), and Pima (97.6%, a difference of 0.010%).
| Demographics | Rating | Rank | 5th Grade |
| Immigrants | Norway | 94.6 /100 | #123 | Exceptional 97.6% |
| Spanish | 93.7 /100 | #124 | Exceptional 97.6% |
| Immigrants | Bulgaria | 93.1 /100 | #125 | Exceptional 97.6% |
| Hmong | 92.3 /100 | #126 | Exceptional 97.6% |
| Immigrants | Serbia | 92.3 /100 | #127 | Exceptional 97.6% |
| Colville | 92.0 /100 | #128 | Exceptional 97.6% |
| Immigrants | Europe | 91.9 /100 | #129 | Exceptional 97.6% |
| Immigrants | Romania | 91.6 /100 | #130 | Exceptional 97.6% |
| Pima | 91.2 /100 | #131 | Exceptional 97.6% |
| Immigrants | Kuwait | 90.4 /100 | #132 | Exceptional 97.6% |
| Cambodians | 90.2 /100 | #133 | Exceptional 97.6% |
| Immigrants | Hungary | 90.1 /100 | #134 | Exceptional 97.6% |
| Palestinians | 89.3 /100 | #135 | Excellent 97.5% |
| Immigrants | Moldova | 87.5 /100 | #136 | Excellent 97.5% |
| Filipinos | 86.8 /100 | #137 | Excellent 97.5% |
Demographics Similar to Americans by 5th Grade
In terms of 5th grade, the demographic groups most similar to Americans are Greek (97.9%, a difference of 0.010%), Austrian (97.9%, a difference of 0.010%), White/Caucasian (97.9%, a difference of 0.010%), Immigrants from Canada (97.9%, a difference of 0.010%), and Australian (98.0%, a difference of 0.020%).
| Demographics | Rating | Rank | 5th Grade |
| Maltese | 99.8 /100 | #52 | Exceptional 98.0% |
| Slavs | 99.8 /100 | #53 | Exceptional 98.0% |
| Australians | 99.8 /100 | #54 | Exceptional 98.0% |
| Creek | 99.8 /100 | #55 | Exceptional 98.0% |
| Greeks | 99.8 /100 | #56 | Exceptional 97.9% |
| Austrians | 99.8 /100 | #57 | Exceptional 97.9% |
| Whites/Caucasians | 99.8 /100 | #58 | Exceptional 97.9% |
| Americans | 99.7 /100 | #59 | Exceptional 97.9% |
| Immigrants | Canada | 99.7 /100 | #60 | Exceptional 97.9% |
| Serbians | 99.7 /100 | #61 | Exceptional 97.9% |
| Immigrants | North America | 99.7 /100 | #62 | Exceptional 97.9% |
| Russians | 99.7 /100 | #63 | Exceptional 97.9% |
| Immigrants | Northern Europe | 99.6 /100 | #64 | Exceptional 97.9% |
| Canadians | 99.6 /100 | #65 | Exceptional 97.9% |
| Immigrants | Austria | 99.6 /100 | #66 | Exceptional 97.9% |