Immigrants from Romania vs Immigrants from Switzerland 5th Grade
COMPARE
Immigrants from Romania
Immigrants from Switzerland
5th Grade
5th Grade Comparison
Immigrants from Romania
Immigrants from Switzerland
97.6%
5TH GRADE
91.6/ 100
METRIC RATING
130th/ 347
METRIC RANK
97.7%
5TH GRADE
96.0/ 100
METRIC RATING
112th/ 347
METRIC RANK
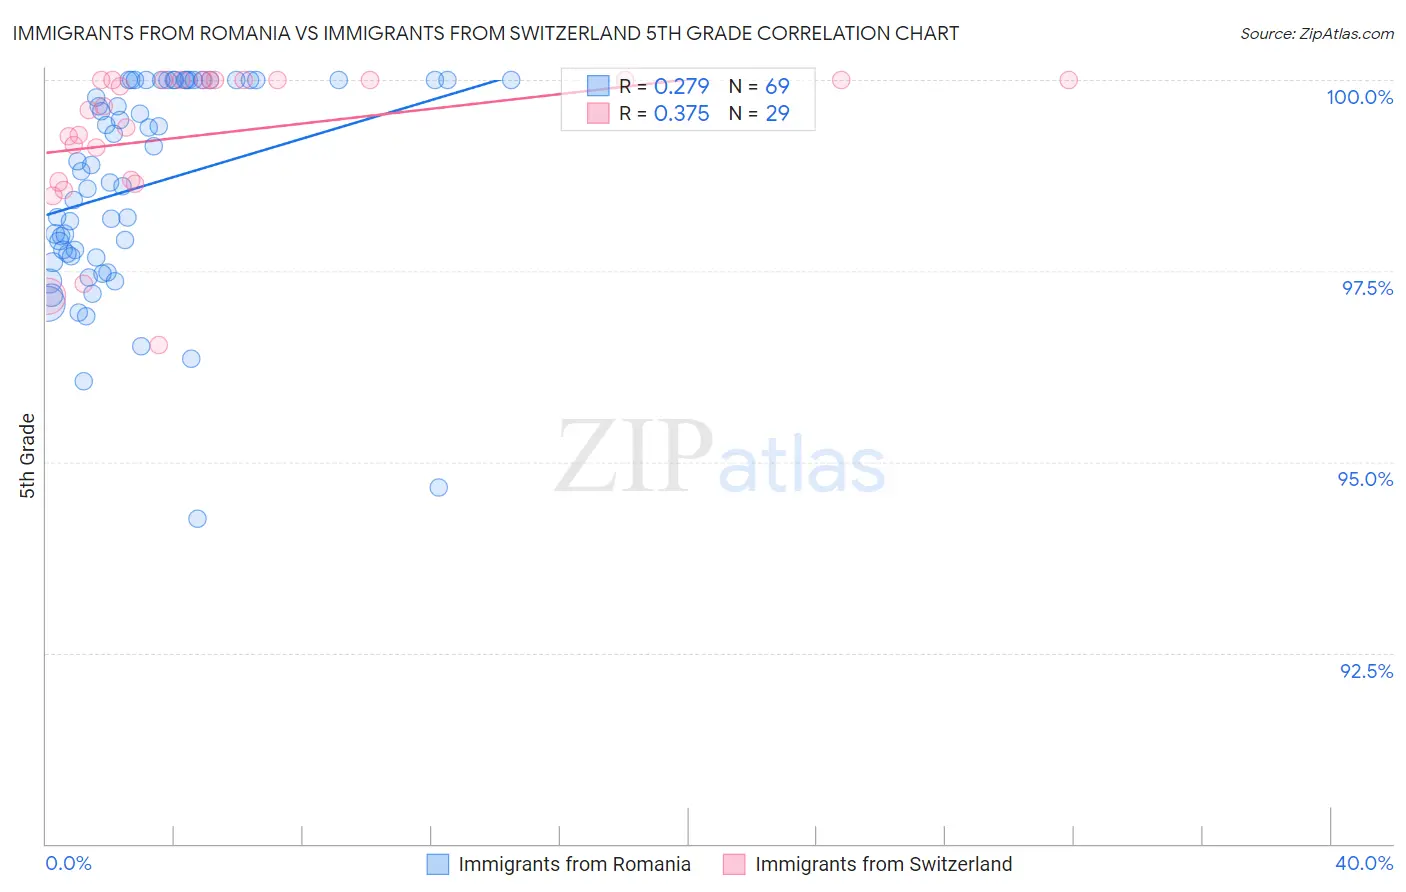
Immigrants from Romania vs Immigrants from Switzerland 5th Grade Correlation Chart
The statistical analysis conducted on geographies consisting of 257,008,799 people shows a weak positive correlation between the proportion of Immigrants from Romania and percentage of population with at least 5th grade education in the United States with a correlation coefficient (R) of 0.279 and weighted average of 97.6%. Similarly, the statistical analysis conducted on geographies consisting of 148,082,451 people shows a mild positive correlation between the proportion of Immigrants from Switzerland and percentage of population with at least 5th grade education in the United States with a correlation coefficient (R) of 0.375 and weighted average of 97.7%, a difference of 0.080%.
5th Grade Correlation Summary
| Measurement | Immigrants from Romania | Immigrants from Switzerland |
| Minimum | 94.3% | 96.5% |
| Maximum | 100.0% | 100.0% |
| Range | 5.7% | 3.5% |
| Mean | 98.6% | 99.3% |
| Median | 98.8% | 99.7% |
| Interquartile 25% (IQ1) | 97.7% | 98.7% |
| Interquartile 75% (IQ3) | 100.0% | 100.0% |
| Interquartile Range (IQR) | 2.3% | 1.3% |
| Standard Deviation (Sample) | 1.4% | 0.95% |
| Standard Deviation (Population) | 1.4% | 0.94% |
Demographics Similar to Immigrants from Romania and Immigrants from Switzerland by 5th Grade
In terms of 5th grade, the demographic groups most similar to Immigrants from Romania are Immigrants from Europe (97.6%, a difference of 0.0%), Hmong (97.6%, a difference of 0.010%), Immigrants from Serbia (97.6%, a difference of 0.010%), Colville (97.6%, a difference of 0.010%), and Pima (97.6%, a difference of 0.010%). Similarly, the demographic groups most similar to Immigrants from Switzerland are Iroquois (97.7%, a difference of 0.0%), Menominee (97.7%, a difference of 0.010%), Lebanese (97.6%, a difference of 0.010%), Okinawan (97.6%, a difference of 0.010%), and Immigrants from Croatia (97.6%, a difference of 0.010%).
| Demographics | Rating | Rank | 5th Grade |
| Menominee | 96.3 /100 | #111 | Exceptional 97.7% |
| Immigrants | Switzerland | 96.0 /100 | #112 | Exceptional 97.7% |
| Iroquois | 95.9 /100 | #113 | Exceptional 97.7% |
| Lebanese | 95.7 /100 | #114 | Exceptional 97.6% |
| Okinawans | 95.7 /100 | #115 | Exceptional 97.6% |
| Immigrants | Croatia | 95.5 /100 | #116 | Exceptional 97.6% |
| Immigrants | Saudi Arabia | 95.4 /100 | #117 | Exceptional 97.6% |
| Basques | 95.2 /100 | #118 | Exceptional 97.6% |
| Syrians | 95.1 /100 | #119 | Exceptional 97.6% |
| Immigrants | Zimbabwe | 94.9 /100 | #120 | Exceptional 97.6% |
| Immigrants | France | 94.8 /100 | #121 | Exceptional 97.6% |
| Immigrants | Japan | 94.7 /100 | #122 | Exceptional 97.6% |
| Immigrants | Norway | 94.6 /100 | #123 | Exceptional 97.6% |
| Spanish | 93.7 /100 | #124 | Exceptional 97.6% |
| Immigrants | Bulgaria | 93.1 /100 | #125 | Exceptional 97.6% |
| Hmong | 92.3 /100 | #126 | Exceptional 97.6% |
| Immigrants | Serbia | 92.3 /100 | #127 | Exceptional 97.6% |
| Colville | 92.0 /100 | #128 | Exceptional 97.6% |
| Immigrants | Europe | 91.9 /100 | #129 | Exceptional 97.6% |
| Immigrants | Romania | 91.6 /100 | #130 | Exceptional 97.6% |
| Pima | 91.2 /100 | #131 | Exceptional 97.6% |