Comanche vs Ute 5th Grade
COMPARE
Comanche
Ute
5th Grade
5th Grade Comparison
Comanche
Ute
97.3%
5TH GRADE
42.1/ 100
METRIC RATING
178th/ 347
METRIC RANK
97.4%
5TH GRADE
74.9/ 100
METRIC RATING
152nd/ 347
METRIC RANK
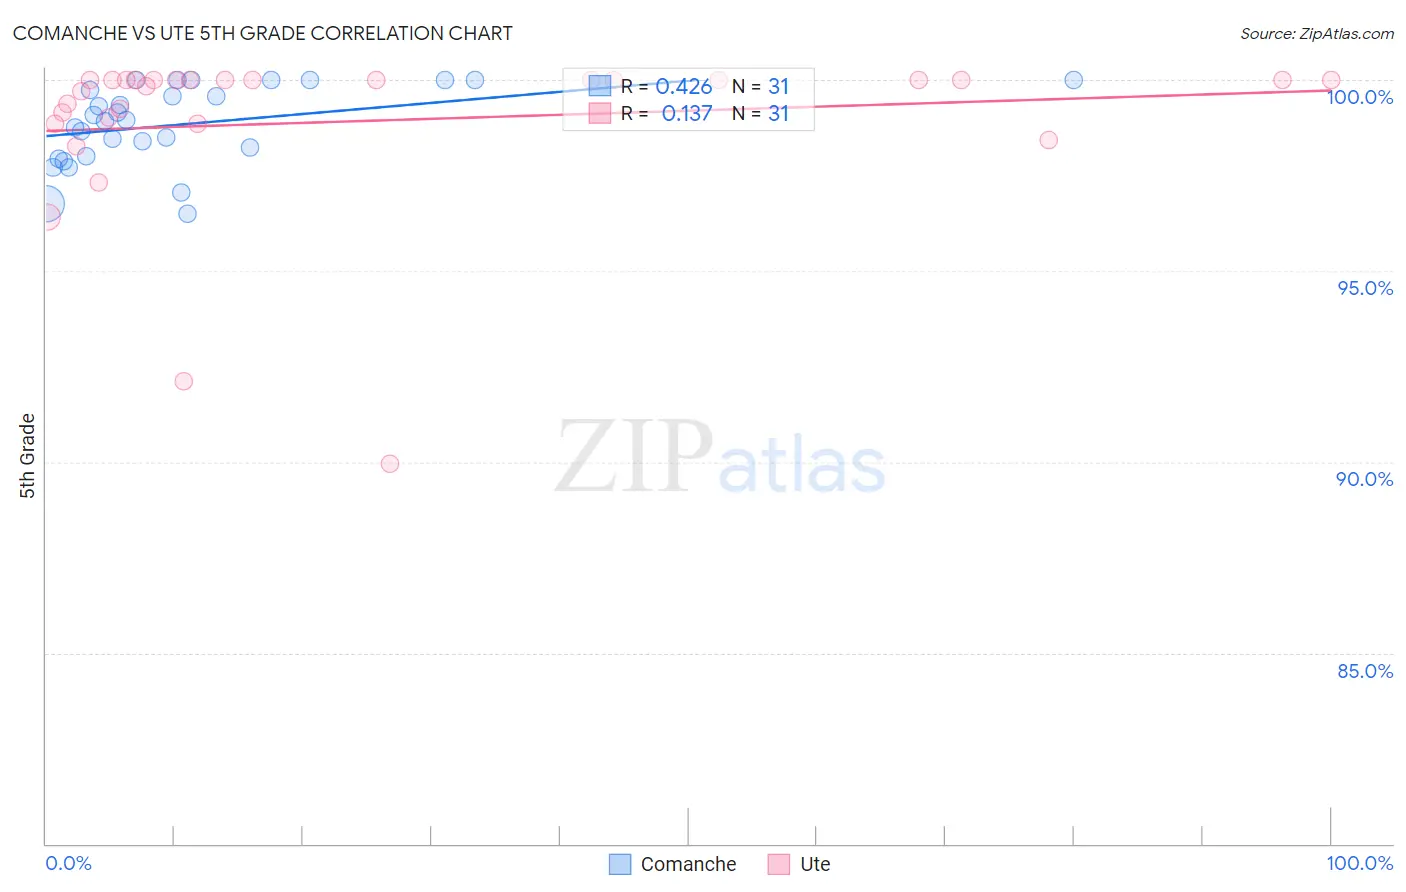
Comanche vs Ute 5th Grade Correlation Chart
The statistical analysis conducted on geographies consisting of 109,786,530 people shows a moderate positive correlation between the proportion of Comanche and percentage of population with at least 5th grade education in the United States with a correlation coefficient (R) of 0.426 and weighted average of 97.3%. Similarly, the statistical analysis conducted on geographies consisting of 55,668,539 people shows a poor positive correlation between the proportion of Ute and percentage of population with at least 5th grade education in the United States with a correlation coefficient (R) of 0.137 and weighted average of 97.4%, a difference of 0.15%.
5th Grade Correlation Summary
| Measurement | Comanche | Ute |
| Minimum | 96.5% | 89.9% |
| Maximum | 100.0% | 100.0% |
| Range | 3.5% | 10.1% |
| Mean | 98.8% | 98.9% |
| Median | 99.0% | 100.0% |
| Interquartile 25% (IQ1) | 98.0% | 98.9% |
| Interquartile 75% (IQ3) | 100.0% | 100.0% |
| Interquartile Range (IQR) | 2.0% | 1.1% |
| Standard Deviation (Sample) | 1.0% | 2.3% |
| Standard Deviation (Population) | 1.0% | 2.3% |
Similar Demographics by 5th Grade
Demographics Similar to Comanche by 5th Grade
In terms of 5th grade, the demographic groups most similar to Comanche are Immigrants from Kenya (97.3%, a difference of 0.010%), Pakistani (97.3%, a difference of 0.010%), Argentinean (97.3%, a difference of 0.010%), Mongolian (97.3%, a difference of 0.010%), and Immigrants from Spain (97.3%, a difference of 0.020%).
| Demographics | Rating | Rank | 5th Grade |
| Immigrants | Sri Lanka | 53.8 /100 | #171 | Average 97.3% |
| Arabs | 53.4 /100 | #172 | Average 97.3% |
| Egyptians | 52.4 /100 | #173 | Average 97.3% |
| Immigrants | Kazakhstan | 50.0 /100 | #174 | Average 97.3% |
| Immigrants | Micronesia | 48.8 /100 | #175 | Average 97.3% |
| Immigrants | Taiwan | 48.4 /100 | #176 | Average 97.3% |
| Immigrants | Spain | 47.0 /100 | #177 | Average 97.3% |
| Comanche | 42.1 /100 | #178 | Average 97.3% |
| Immigrants | Kenya | 40.3 /100 | #179 | Average 97.3% |
| Pakistanis | 40.2 /100 | #180 | Average 97.3% |
| Argentineans | 39.5 /100 | #181 | Fair 97.3% |
| Mongolians | 39.4 /100 | #182 | Fair 97.3% |
| Immigrants | Ukraine | 38.6 /100 | #183 | Fair 97.3% |
| Immigrants | Venezuela | 38.4 /100 | #184 | Fair 97.3% |
| Dutch West Indians | 36.2 /100 | #185 | Fair 97.3% |
Demographics Similar to Ute by 5th Grade
In terms of 5th grade, the demographic groups most similar to Ute are Immigrants from Eastern Europe (97.4%, a difference of 0.0%), Alsatian (97.4%, a difference of 0.0%), Immigrants from Israel (97.5%, a difference of 0.020%), Hopi (97.5%, a difference of 0.020%), and Immigrants from South Central Asia (97.5%, a difference of 0.020%).
| Demographics | Rating | Rank | 5th Grade |
| Jordanians | 82.6 /100 | #145 | Excellent 97.5% |
| Spaniards | 81.9 /100 | #146 | Excellent 97.5% |
| Soviet Union | 81.2 /100 | #147 | Excellent 97.5% |
| Immigrants | Israel | 79.1 /100 | #148 | Good 97.5% |
| Hopi | 78.6 /100 | #149 | Good 97.5% |
| Immigrants | South Central Asia | 78.6 /100 | #150 | Good 97.5% |
| Immigrants | Eastern Europe | 75.0 /100 | #151 | Good 97.4% |
| Ute | 74.9 /100 | #152 | Good 97.4% |
| Alsatians | 74.3 /100 | #153 | Good 97.4% |
| Immigrants | Russia | 71.2 /100 | #154 | Good 97.4% |
| Immigrants | Bosnia and Herzegovina | 71.0 /100 | #155 | Good 97.4% |
| French American Indians | 70.5 /100 | #156 | Good 97.4% |
| Immigrants | Jordan | 70.4 /100 | #157 | Good 97.4% |
| Albanians | 68.3 /100 | #158 | Good 97.4% |
| Immigrants | Italy | 65.2 /100 | #159 | Good 97.4% |