Immigrants from Romania vs Ute College, Under 1 year
COMPARE
Immigrants from Romania
Ute
College, Under 1 year
College, Under 1 year Comparison
Immigrants from Romania
Ute
68.9%
COLLEGE, UNDER 1 YEAR
99.2/ 100
METRIC RATING
69th/ 347
METRIC RANK
60.2%
COLLEGE, UNDER 1 YEAR
0.1/ 100
METRIC RATING
279th/ 347
METRIC RANK
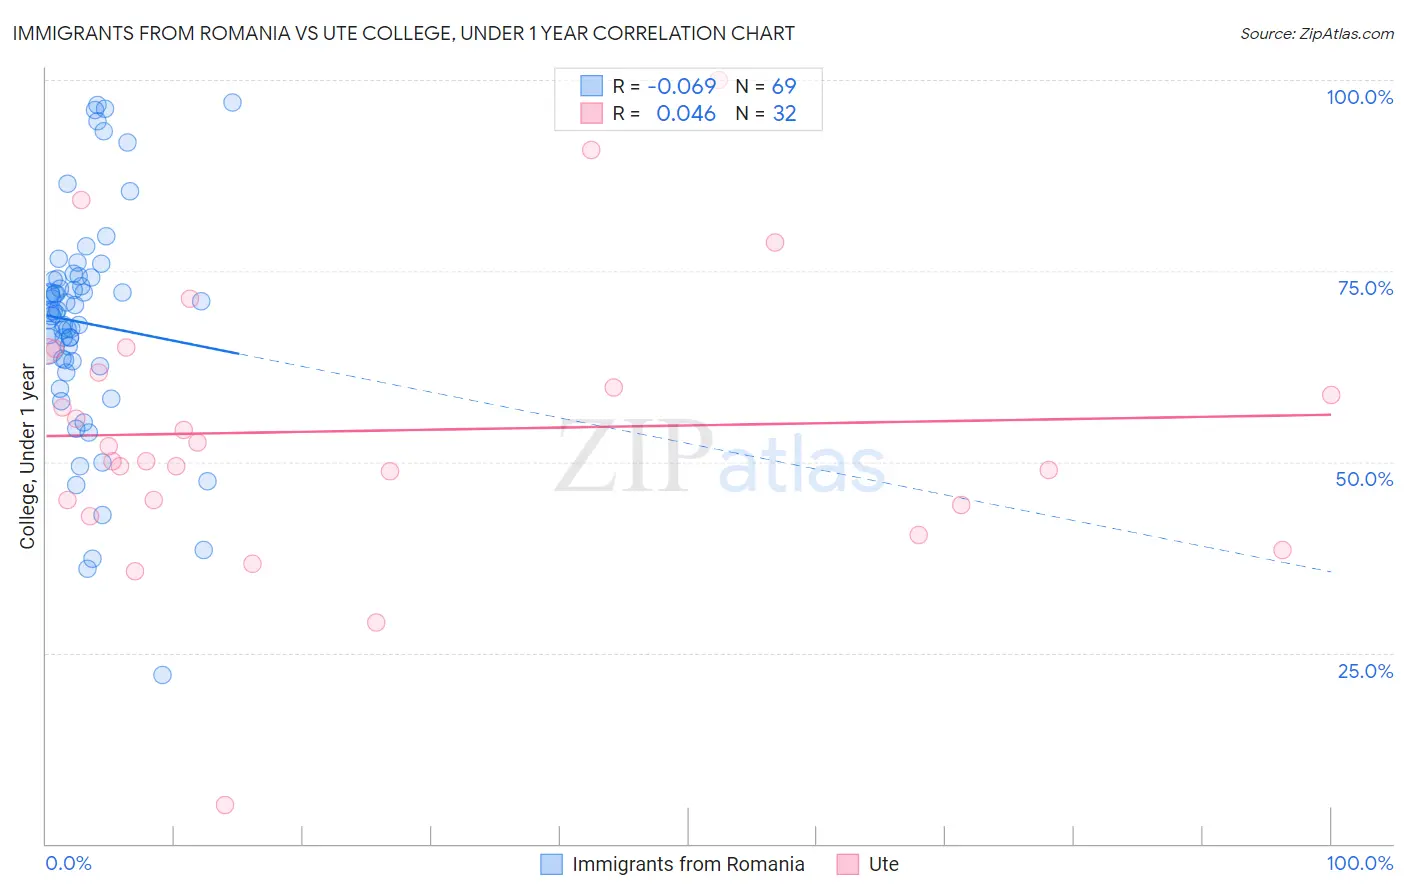
Immigrants from Romania vs Ute College, Under 1 year Correlation Chart
The statistical analysis conducted on geographies consisting of 257,013,839 people shows a slight negative correlation between the proportion of Immigrants from Romania and percentage of population with at least college, under 1 year education in the United States with a correlation coefficient (R) of -0.069 and weighted average of 68.9%. Similarly, the statistical analysis conducted on geographies consisting of 55,668,599 people shows no correlation between the proportion of Ute and percentage of population with at least college, under 1 year education in the United States with a correlation coefficient (R) of 0.046 and weighted average of 60.2%, a difference of 14.4%.
College, Under 1 year Correlation Summary
| Measurement | Immigrants from Romania | Ute |
| Minimum | 22.2% | 5.1% |
| Maximum | 97.0% | 100.0% |
| Range | 74.9% | 94.9% |
| Mean | 68.2% | 54.1% |
| Median | 69.6% | 51.1% |
| Interquartile 25% (IQ1) | 62.9% | 44.6% |
| Interquartile 75% (IQ3) | 74.0% | 63.1% |
| Interquartile Range (IQR) | 11.2% | 18.5% |
| Standard Deviation (Sample) | 14.7% | 18.3% |
| Standard Deviation (Population) | 14.6% | 18.0% |
Similar Demographics by College, Under 1 year
Demographics Similar to Immigrants from Romania by College, Under 1 year
In terms of college, under 1 year, the demographic groups most similar to Immigrants from Romania are Immigrants from Indonesia (68.9%, a difference of 0.020%), Immigrants from Zimbabwe (68.9%, a difference of 0.050%), Lithuanian (68.8%, a difference of 0.16%), Immigrants from Europe (68.8%, a difference of 0.18%), and Immigrants from North America (69.0%, a difference of 0.19%).
| Demographics | Rating | Rank | College, Under 1 year |
| Immigrants | Belarus | 99.5 /100 | #62 | Exceptional 69.2% |
| Immigrants | Canada | 99.4 /100 | #63 | Exceptional 69.1% |
| Northern Europeans | 99.4 /100 | #64 | Exceptional 69.0% |
| Immigrants | Moldova | 99.3 /100 | #65 | Exceptional 69.0% |
| Immigrants | North America | 99.3 /100 | #66 | Exceptional 69.0% |
| Immigrants | Zimbabwe | 99.2 /100 | #67 | Exceptional 68.9% |
| Immigrants | Indonesia | 99.2 /100 | #68 | Exceptional 68.9% |
| Immigrants | Romania | 99.2 /100 | #69 | Exceptional 68.9% |
| Lithuanians | 99.1 /100 | #70 | Exceptional 68.8% |
| Immigrants | Europe | 99.1 /100 | #71 | Exceptional 68.8% |
| Bolivians | 99.0 /100 | #72 | Exceptional 68.7% |
| Immigrants | England | 99.0 /100 | #73 | Exceptional 68.7% |
| Swedes | 98.9 /100 | #74 | Exceptional 68.7% |
| Immigrants | Western Europe | 98.6 /100 | #75 | Exceptional 68.5% |
| Laotians | 98.6 /100 | #76 | Exceptional 68.5% |
Demographics Similar to Ute by College, Under 1 year
In terms of college, under 1 year, the demographic groups most similar to Ute are Yaqui (60.2%, a difference of 0.010%), Bahamian (60.3%, a difference of 0.050%), Crow (60.2%, a difference of 0.090%), Arapaho (60.3%, a difference of 0.18%), and Cherokee (60.1%, a difference of 0.20%).
| Demographics | Rating | Rank | College, Under 1 year |
| Jamaicans | 0.1 /100 | #272 | Tragic 60.5% |
| Chickasaw | 0.1 /100 | #273 | Tragic 60.4% |
| Alaska Natives | 0.1 /100 | #274 | Tragic 60.4% |
| Immigrants | Barbados | 0.1 /100 | #275 | Tragic 60.4% |
| Arapaho | 0.1 /100 | #276 | Tragic 60.3% |
| Bahamians | 0.1 /100 | #277 | Tragic 60.3% |
| Yaqui | 0.1 /100 | #278 | Tragic 60.2% |
| Ute | 0.1 /100 | #279 | Tragic 60.2% |
| Crow | 0.1 /100 | #280 | Tragic 60.2% |
| Cherokee | 0.1 /100 | #281 | Tragic 60.1% |
| Belizeans | 0.1 /100 | #282 | Tragic 60.1% |
| Immigrants | Jamaica | 0.0 /100 | #283 | Tragic 59.7% |
| Immigrants | St. Vincent and the Grenadines | 0.0 /100 | #284 | Tragic 59.6% |
| Paiute | 0.0 /100 | #285 | Tragic 59.6% |
| British West Indians | 0.0 /100 | #286 | Tragic 59.5% |