Immigrants from Portugal vs Immigrants from Trinidad and Tobago College, Under 1 year
COMPARE
Immigrants from Portugal
Immigrants from Trinidad and Tobago
College, Under 1 year
College, Under 1 year Comparison
Immigrants from Portugal
Immigrants from Trinidad and Tobago
57.7%
COLLEGE, UNDER 1 YEAR
0.0/ 100
METRIC RATING
306th/ 347
METRIC RANK
60.7%
COLLEGE, UNDER 1 YEAR
0.1/ 100
METRIC RATING
268th/ 347
METRIC RANK
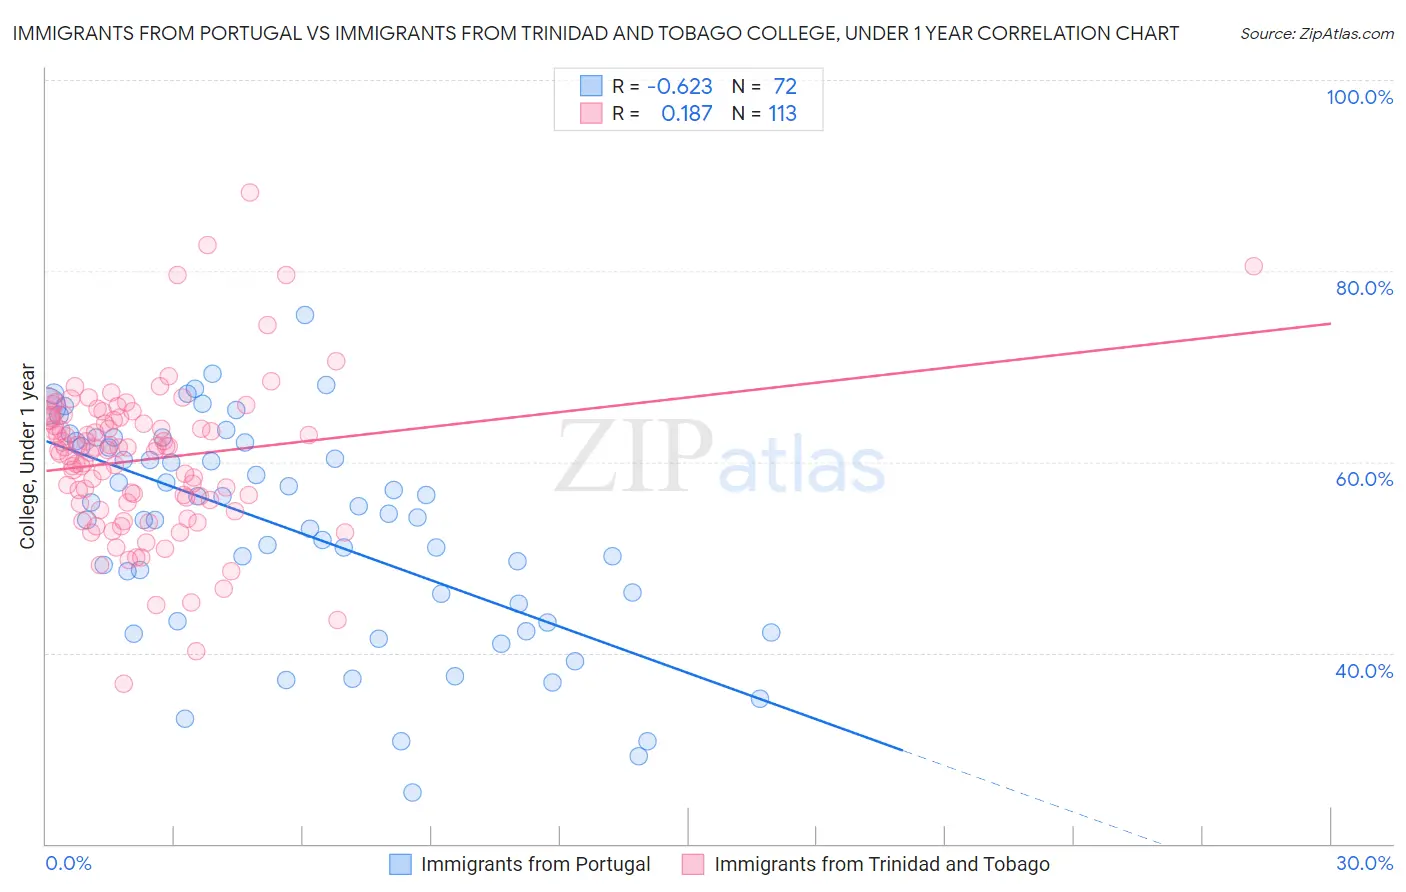
Immigrants from Portugal vs Immigrants from Trinidad and Tobago College, Under 1 year Correlation Chart
The statistical analysis conducted on geographies consisting of 174,792,047 people shows a significant negative correlation between the proportion of Immigrants from Portugal and percentage of population with at least college, under 1 year education in the United States with a correlation coefficient (R) of -0.623 and weighted average of 57.7%. Similarly, the statistical analysis conducted on geographies consisting of 223,526,872 people shows a poor positive correlation between the proportion of Immigrants from Trinidad and Tobago and percentage of population with at least college, under 1 year education in the United States with a correlation coefficient (R) of 0.187 and weighted average of 60.7%, a difference of 5.3%.
College, Under 1 year Correlation Summary
| Measurement | Immigrants from Portugal | Immigrants from Trinidad and Tobago |
| Minimum | 25.4% | 36.7% |
| Maximum | 75.4% | 88.2% |
| Range | 50.1% | 51.4% |
| Mean | 52.8% | 60.3% |
| Median | 54.4% | 61.2% |
| Interquartile 25% (IQ1) | 44.2% | 55.6% |
| Interquartile 75% (IQ3) | 61.8% | 64.6% |
| Interquartile Range (IQR) | 17.6% | 9.0% |
| Standard Deviation (Sample) | 11.2% | 8.0% |
| Standard Deviation (Population) | 11.1% | 8.0% |
Similar Demographics by College, Under 1 year
Demographics Similar to Immigrants from Portugal by College, Under 1 year
In terms of college, under 1 year, the demographic groups most similar to Immigrants from Portugal are Fijian (57.7%, a difference of 0.010%), Central American (57.7%, a difference of 0.010%), Immigrants from Nicaragua (57.6%, a difference of 0.14%), Haitian (57.8%, a difference of 0.20%), and Kiowa (57.8%, a difference of 0.31%).
| Demographics | Rating | Rank | College, Under 1 year |
| Cubans | 0.0 /100 | #299 | Tragic 58.6% |
| Immigrants | Guyana | 0.0 /100 | #300 | Tragic 58.5% |
| Mexican American Indians | 0.0 /100 | #301 | Tragic 58.1% |
| Apache | 0.0 /100 | #302 | Tragic 58.0% |
| Immigrants | Dominica | 0.0 /100 | #303 | Tragic 57.9% |
| Kiowa | 0.0 /100 | #304 | Tragic 57.8% |
| Haitians | 0.0 /100 | #305 | Tragic 57.8% |
| Immigrants | Portugal | 0.0 /100 | #306 | Tragic 57.7% |
| Fijians | 0.0 /100 | #307 | Tragic 57.7% |
| Central Americans | 0.0 /100 | #308 | Tragic 57.7% |
| Immigrants | Nicaragua | 0.0 /100 | #309 | Tragic 57.6% |
| Pueblo | 0.0 /100 | #310 | Tragic 57.4% |
| Cajuns | 0.0 /100 | #311 | Tragic 57.3% |
| Salvadorans | 0.0 /100 | #312 | Tragic 57.3% |
| Dutch West Indians | 0.0 /100 | #313 | Tragic 57.2% |
Demographics Similar to Immigrants from Trinidad and Tobago by College, Under 1 year
In terms of college, under 1 year, the demographic groups most similar to Immigrants from Trinidad and Tobago are Immigrants from West Indies (60.6%, a difference of 0.12%), Cheyenne (60.6%, a difference of 0.23%), U.S. Virgin Islander (60.6%, a difference of 0.24%), Jamaican (60.5%, a difference of 0.40%), and Chickasaw (60.4%, a difference of 0.44%).
| Demographics | Rating | Rank | College, Under 1 year |
| Africans | 0.3 /100 | #261 | Tragic 61.1% |
| Barbadians | 0.2 /100 | #262 | Tragic 61.1% |
| Shoshone | 0.2 /100 | #263 | Tragic 61.1% |
| Trinidadians and Tobagonians | 0.2 /100 | #264 | Tragic 61.1% |
| Immigrants | Bahamas | 0.2 /100 | #265 | Tragic 61.1% |
| Alaskan Athabascans | 0.2 /100 | #266 | Tragic 61.0% |
| Americans | 0.2 /100 | #267 | Tragic 61.0% |
| Immigrants | Trinidad and Tobago | 0.1 /100 | #268 | Tragic 60.7% |
| Immigrants | West Indies | 0.1 /100 | #269 | Tragic 60.6% |
| Cheyenne | 0.1 /100 | #270 | Tragic 60.6% |
| U.S. Virgin Islanders | 0.1 /100 | #271 | Tragic 60.6% |
| Jamaicans | 0.1 /100 | #272 | Tragic 60.5% |
| Chickasaw | 0.1 /100 | #273 | Tragic 60.4% |
| Alaska Natives | 0.1 /100 | #274 | Tragic 60.4% |
| Immigrants | Barbados | 0.1 /100 | #275 | Tragic 60.4% |