Immigrants from Albania vs Immigrants from Trinidad and Tobago College, Under 1 year
COMPARE
Immigrants from Albania
Immigrants from Trinidad and Tobago
College, Under 1 year
College, Under 1 year Comparison
Immigrants from Albania
Immigrants from Trinidad and Tobago
64.9%
COLLEGE, UNDER 1 YEAR
32.0/ 100
METRIC RATING
188th/ 347
METRIC RANK
60.7%
COLLEGE, UNDER 1 YEAR
0.1/ 100
METRIC RATING
268th/ 347
METRIC RANK
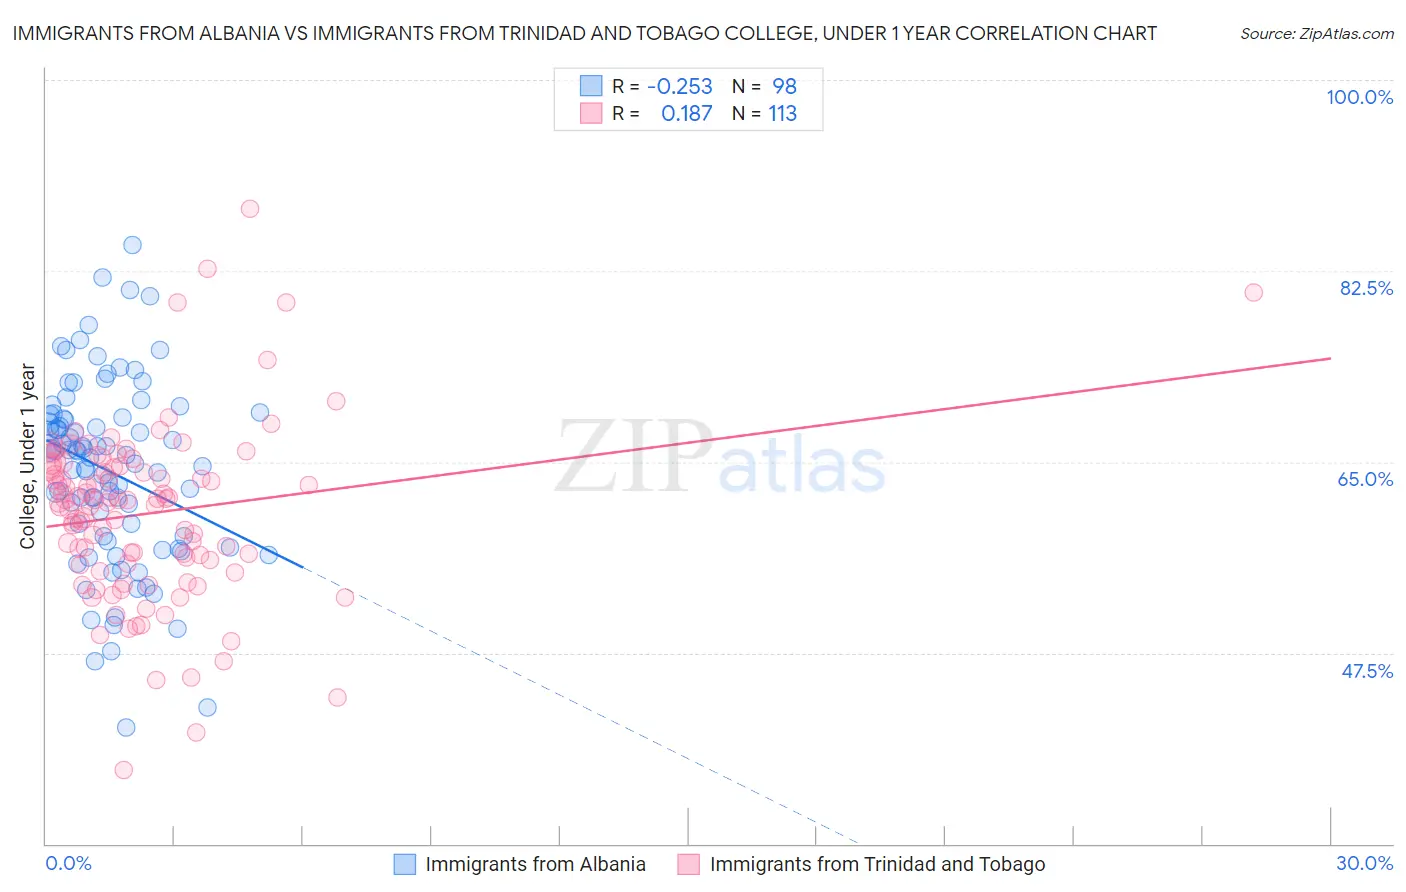
Immigrants from Albania vs Immigrants from Trinidad and Tobago College, Under 1 year Correlation Chart
The statistical analysis conducted on geographies consisting of 119,397,636 people shows a weak negative correlation between the proportion of Immigrants from Albania and percentage of population with at least college, under 1 year education in the United States with a correlation coefficient (R) of -0.253 and weighted average of 64.9%. Similarly, the statistical analysis conducted on geographies consisting of 223,526,872 people shows a poor positive correlation between the proportion of Immigrants from Trinidad and Tobago and percentage of population with at least college, under 1 year education in the United States with a correlation coefficient (R) of 0.187 and weighted average of 60.7%, a difference of 6.9%.
College, Under 1 year Correlation Summary
| Measurement | Immigrants from Albania | Immigrants from Trinidad and Tobago |
| Minimum | 40.7% | 36.7% |
| Maximum | 84.9% | 88.2% |
| Range | 44.2% | 51.4% |
| Mean | 64.1% | 60.3% |
| Median | 65.5% | 61.2% |
| Interquartile 25% (IQ1) | 58.2% | 55.6% |
| Interquartile 75% (IQ3) | 69.1% | 64.6% |
| Interquartile Range (IQR) | 10.9% | 9.0% |
| Standard Deviation (Sample) | 8.4% | 8.0% |
| Standard Deviation (Population) | 8.4% | 8.0% |
Similar Demographics by College, Under 1 year
Demographics Similar to Immigrants from Albania by College, Under 1 year
In terms of college, under 1 year, the demographic groups most similar to Immigrants from Albania are Spanish (64.9%, a difference of 0.020%), Immigrants from Philippines (64.8%, a difference of 0.10%), Immigrants from Southern Europe (64.9%, a difference of 0.11%), Immigrants from Armenia (64.7%, a difference of 0.21%), and Immigrants from Thailand (64.7%, a difference of 0.27%).
| Demographics | Rating | Rank | College, Under 1 year |
| Spaniards | 45.5 /100 | #181 | Average 65.3% |
| Immigrants | Africa | 44.7 /100 | #182 | Average 65.3% |
| Immigrants | Poland | 42.6 /100 | #183 | Average 65.2% |
| Bermudans | 42.0 /100 | #184 | Average 65.2% |
| Sri Lankans | 41.7 /100 | #185 | Average 65.2% |
| Immigrants | Sierra Leone | 39.7 /100 | #186 | Fair 65.1% |
| Immigrants | Southern Europe | 34.3 /100 | #187 | Fair 64.9% |
| Immigrants | Albania | 32.0 /100 | #188 | Fair 64.9% |
| Spanish | 31.6 /100 | #189 | Fair 64.9% |
| Immigrants | Philippines | 30.1 /100 | #190 | Fair 64.8% |
| Immigrants | Armenia | 28.1 /100 | #191 | Fair 64.7% |
| Immigrants | Thailand | 27.0 /100 | #192 | Fair 64.7% |
| Slovaks | 26.7 /100 | #193 | Fair 64.7% |
| Immigrants | Cameroon | 24.6 /100 | #194 | Fair 64.6% |
| Immigrants | South Eastern Asia | 22.1 /100 | #195 | Fair 64.5% |
Demographics Similar to Immigrants from Trinidad and Tobago by College, Under 1 year
In terms of college, under 1 year, the demographic groups most similar to Immigrants from Trinidad and Tobago are Immigrants from West Indies (60.6%, a difference of 0.12%), Cheyenne (60.6%, a difference of 0.23%), U.S. Virgin Islander (60.6%, a difference of 0.24%), Jamaican (60.5%, a difference of 0.40%), and Chickasaw (60.4%, a difference of 0.44%).
| Demographics | Rating | Rank | College, Under 1 year |
| Africans | 0.3 /100 | #261 | Tragic 61.1% |
| Barbadians | 0.2 /100 | #262 | Tragic 61.1% |
| Shoshone | 0.2 /100 | #263 | Tragic 61.1% |
| Trinidadians and Tobagonians | 0.2 /100 | #264 | Tragic 61.1% |
| Immigrants | Bahamas | 0.2 /100 | #265 | Tragic 61.1% |
| Alaskan Athabascans | 0.2 /100 | #266 | Tragic 61.0% |
| Americans | 0.2 /100 | #267 | Tragic 61.0% |
| Immigrants | Trinidad and Tobago | 0.1 /100 | #268 | Tragic 60.7% |
| Immigrants | West Indies | 0.1 /100 | #269 | Tragic 60.6% |
| Cheyenne | 0.1 /100 | #270 | Tragic 60.6% |
| U.S. Virgin Islanders | 0.1 /100 | #271 | Tragic 60.6% |
| Jamaicans | 0.1 /100 | #272 | Tragic 60.5% |
| Chickasaw | 0.1 /100 | #273 | Tragic 60.4% |
| Alaska Natives | 0.1 /100 | #274 | Tragic 60.4% |
| Immigrants | Barbados | 0.1 /100 | #275 | Tragic 60.4% |