Immigrants from Portugal vs Immigrants from Trinidad and Tobago Currently Married

COMPARE

Immigrants from Portugal
Race
Ancestry
AfghanAfricanAlaska NativeAlaskan AthabascanAlbanianAleutAlsatianAmericanApacheArabArapahoArgentineanArmenianAssyrian/Chaldean/SyriacAustralianAustrianBahamianBangladeshiBarbadianBasqueBelgianBelizeanBermudanBhutaneseBlackfeetBolivianBrazilianBritishBritish West IndianBulgarianBurmeseCajunCambodianCanadianCape VerdeanCarpatho RusynCelticCentral AmericanCentral American IndianCherokeeCheyenneChickasawChileanChineseChippewaChoctawColombianColvilleComancheCosta RicanCreeCreekCroatianCrowCubanCypriotCzechCzechoslovakianDanishDelawareDominicanDutchDutch West IndianEastern EuropeanEcuadorianEgyptianEnglishEstonianEthiopianEuropeanFijianFilipinoFinnishFrenchFrench American IndianFrench CanadianGermanGerman RussianGhanaianGreekGuamanian/ChamorroGuatemalanGuyaneseHaitianHmongHonduranHopiHoumaHungarianIcelanderIndian (Asian)IndonesianInupiatIranianIraqiIrishIroquoisIsraeliItalianJamaicanJapaneseJordanianKenyanKiowaKoreanLaotianLatvianLebaneseLiberianLithuanianLumbeeLuxembourgerMacedonianMalaysianMalteseMarshalleseMenomineeMexicanMexican American IndianMongolianMoroccanNative HawaiianNavajoNepaleseNew ZealanderNicaraguanNigerianNorthern EuropeanNorwegianOkinawanOsageOttawaPaiutePakistaniPalestinianPanamanianParaguayanPennsylvania GermanPeruvianPimaPolishPortuguesePotawatomiPuebloPuerto RicanPuget Sound SalishRomanianRussianSalvadoranSamoanScandinavianScotch-IrishScottishSeminoleSenegaleseSerbianShoshoneSierra LeoneanSiouxSlavicSlovakSloveneSomaliSouth AfricanSouth AmericanSouth American IndianSoviet UnionSpaniardSpanishSpanish AmericanSpanish American IndianSri LankanSubsaharan AfricanSudaneseSwedishSwissSyrianTaiwaneseThaiTlingit-HaidaTohono O'OdhamTonganTrinidadian and TobagonianTsimshianTurkishU.S. Virgin IslanderUgandanUkrainianUruguayanUteVenezuelanVietnameseWelshWest IndianYakamaYaquiYugoslavianYumanYup'ikZimbabwean
Immigration
NonimmigrantsImmigrantsAfghanistanAfricaAlbaniaArgentinaArmeniaAsiaAustraliaAustriaBahamasBangladeshBarbadosBelarusBelgiumBelizeBoliviaBosnia and HerzegovinaBrazilBulgariaBurma/MyanmarCabo VerdeCambodiaCameroonCanadaCaribbeanCentral AmericaChileChinaColombiaCongoCosta RicaCroatiaCubaCzechoslovakiaDenmarkDominicaDominican RepublicEastern AfricaEastern AsiaEastern EuropeEcuadorEgyptEl SalvadorEnglandEritreaEthiopiaEuropeFijiFranceGermanyGhanaGreeceGrenadaGuatemalaGuyanaHaitiHondurasHong KongHungaryIndiaIndonesiaIranIraqIrelandIsraelItalyJamaicaJapanJordanKazakhstanKenyaKoreaKuwaitLaosLatin AmericaLatviaLebanonLiberiaLithuaniaMalaysiaMexicoMicronesiaMiddle AfricaMoldovaMoroccoNepalNetherlandsNicaraguaNigeriaNorth AmericaNorth MacedoniaNorthern AfricaNorthern EuropeNorwayOceaniaPakistanPanamaPeruPhilippinesPolandPortugalRomaniaRussiaSaudi ArabiaScotlandSenegalSerbiaSierra LeoneSingaporeSomaliaSouth AfricaSouth AmericaSouth Central AsiaSouth Eastern AsiaSouthern EuropeSpainSri LankaSt. Vincent and the GrenadinesSudanSwedenSwitzerlandSyriaTaiwanThailandTurkeyUgandaUkraineUruguayUzbekistanVenezuelaVietnamWest IndiesWestern AfricaWestern AsiaWestern EuropeYemenZaireZimbabweAzores
Immigrants from Trinidad and Tobago
Race
Ancestry
AfghanAfricanAlaska NativeAlaskan AthabascanAlbanianAleutAlsatianAmericanApacheArabArapahoArgentineanArmenianAssyrian/Chaldean/SyriacAustralianAustrianBahamianBangladeshiBarbadianBasqueBelgianBelizeanBermudanBhutaneseBlackfeetBolivianBrazilianBritishBritish West IndianBulgarianBurmeseCajunCambodianCanadianCape VerdeanCarpatho RusynCelticCentral AmericanCentral American IndianCherokeeCheyenneChickasawChileanChineseChippewaChoctawColombianColvilleComancheCosta RicanCreeCreekCroatianCrowCubanCypriotCzechCzechoslovakianDanishDelawareDominicanDutchDutch West IndianEastern EuropeanEcuadorianEgyptianEnglishEstonianEthiopianEuropeanFijianFilipinoFinnishFrenchFrench American IndianFrench CanadianGermanGerman RussianGhanaianGreekGuamanian/ChamorroGuatemalanGuyaneseHaitianHmongHonduranHopiHoumaHungarianIcelanderIndian (Asian)IndonesianInupiatIranianIraqiIrishIroquoisIsraeliItalianJamaicanJapaneseJordanianKenyanKiowaKoreanLaotianLatvianLebaneseLiberianLithuanianLumbeeLuxembourgerMacedonianMalaysianMalteseMarshalleseMenomineeMexicanMexican American IndianMongolianMoroccanNative HawaiianNavajoNepaleseNew ZealanderNicaraguanNigerianNorthern EuropeanNorwegianOkinawanOsageOttawaPaiutePakistaniPalestinianPanamanianParaguayanPennsylvania GermanPeruvianPimaPolishPortuguesePotawatomiPuebloPuerto RicanPuget Sound SalishRomanianRussianSalvadoranSamoanScandinavianScotch-IrishScottishSeminoleSenegaleseSerbianShoshoneSierra LeoneanSiouxSlavicSlovakSloveneSomaliSouth AfricanSouth AmericanSouth American IndianSoviet UnionSpaniardSpanishSpanish AmericanSpanish American IndianSri LankanSubsaharan AfricanSudaneseSwedishSwissSyrianTaiwaneseThaiTlingit-HaidaTohono O'OdhamTonganTrinidadian and TobagonianTsimshianTurkishU.S. Virgin IslanderUgandanUkrainianUruguayanUteVenezuelanVietnameseWelshWest IndianYakamaYaquiYugoslavianYumanYup'ikZimbabwean
Immigration
NonimmigrantsImmigrantsAfghanistanAfricaAlbaniaArgentinaArmeniaAsiaAustraliaAustriaBahamasBangladeshBarbadosBelarusBelgiumBelizeBoliviaBosnia and HerzegovinaBrazilBulgariaBurma/MyanmarCabo VerdeCambodiaCameroonCanadaCaribbeanCentral AmericaChileChinaColombiaCongoCosta RicaCroatiaCubaCzechoslovakiaDenmarkDominicaDominican RepublicEastern AfricaEastern AsiaEastern EuropeEcuadorEgyptEl SalvadorEnglandEritreaEthiopiaEuropeFijiFranceGermanyGhanaGreeceGrenadaGuatemalaGuyanaHaitiHondurasHong KongHungaryIndiaIndonesiaIranIraqIrelandIsraelItalyJamaicaJapanJordanKazakhstanKenyaKoreaKuwaitLaosLatin AmericaLatviaLebanonLiberiaLithuaniaMalaysiaMexicoMicronesiaMiddle AfricaMoldovaMoroccoNepalNetherlandsNicaraguaNigeriaNorth AmericaNorth MacedoniaNorthern AfricaNorthern EuropeNorwayOceaniaPakistanPanamaPeruPhilippinesPolandRomaniaRussiaSaudi ArabiaScotlandSenegalSerbiaSierra LeoneSingaporeSomaliaSouth AfricaSouth AmericaSouth Central AsiaSouth Eastern AsiaSouthern EuropeSpainSri LankaSt. Vincent and the GrenadinesSudanSwedenSwitzerlandSyriaTaiwanThailandTrinidad and TobagoTurkeyUgandaUkraineUruguayUzbekistanVenezuelaVietnamWest IndiesWestern AfricaWestern AsiaWestern EuropeYemenZaireZimbabweAzores
Currently Married
Income
Poverty
Unemployment
Labor Participation
Family Structure
Vehicle Availability
Education Level
Disability

Currently Married Comparison

Immigrants from Portugal

Immigrants from Trinidad and Tobago

Tragic
Tragic
45.2%
CURRENTLY MARRIED
3.5/ 100
METRIC RATING
219th/ 347
METRIC RANK
41.9%
CURRENTLY MARRIED
0.0/ 100
METRIC RATING
305th/ 347
METRIC RANK

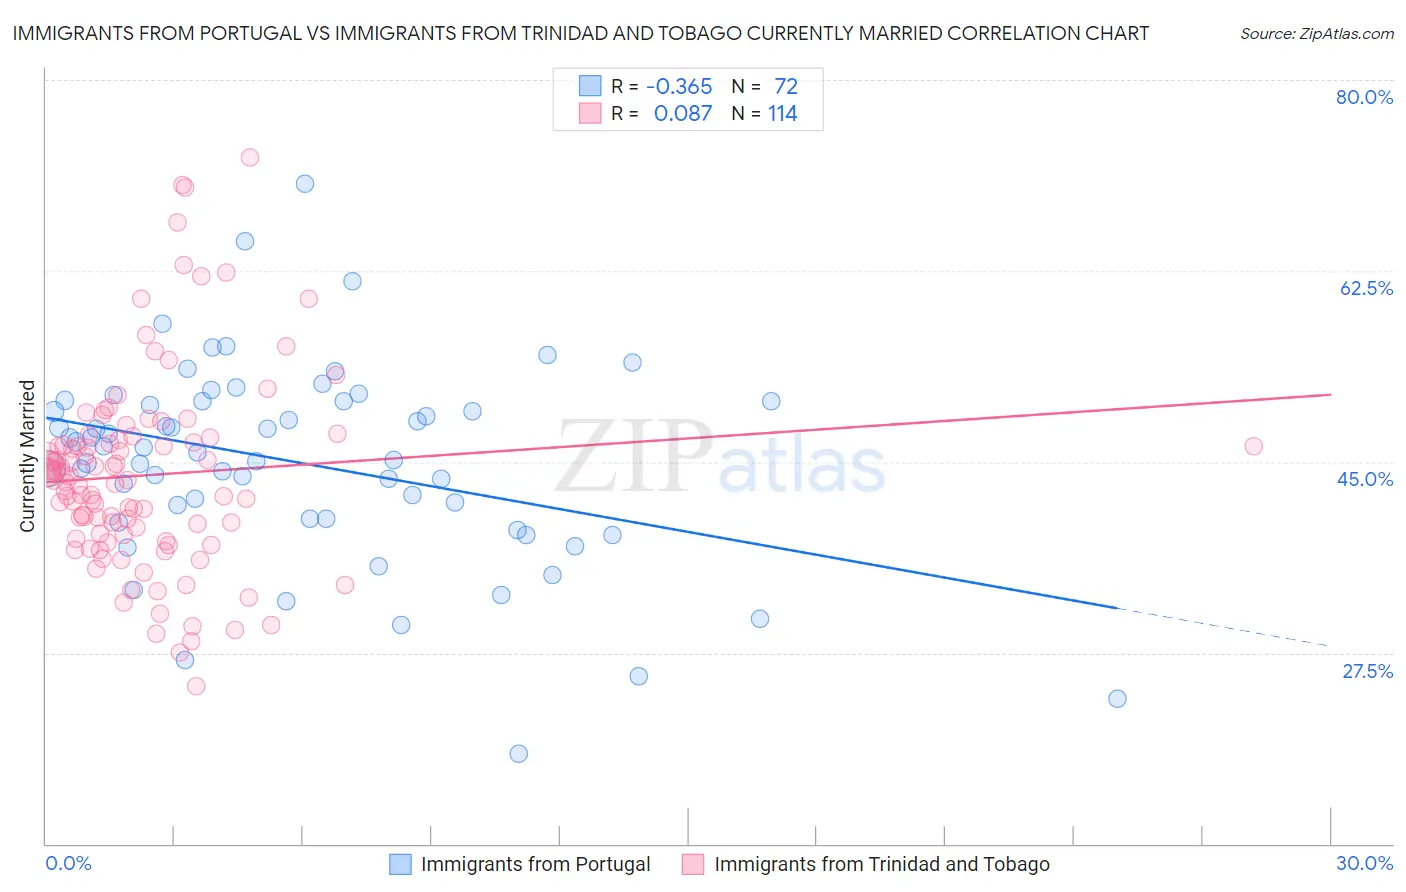
Immigrants from Portugal vs Immigrants from Trinidad and Tobago Currently Married Correlation Chart

The statistical analysis conducted on geographies consisting of 174,784,868 people shows a mild negative correlation between the proportion of Immigrants from Portugal and percentage of population currently married in the United States with a correlation coefficient (R) of -0.365 and weighted average of 45.2%. Similarly, the statistical analysis conducted on geographies consisting of 223,527,783 people shows a slight positive correlation between the proportion of Immigrants from Trinidad and Tobago and percentage of population currently married in the United States with a correlation coefficient (R) of 0.087 and weighted average of 41.9%, a difference of 8.0%.
Immigrants from Portugal vs Immigrants from Trinidad and Tobago Currently Married

Currently Married Correlation Summary

MeasurementImmigrants from PortugalImmigrants from Trinidad and Tobago
Minimum18.3%24.4%
Maximum70.5%72.9%
Range52.2%48.5%
Mean44.9%43.8%
Median46.1%43.4%
Interquartile 25% (IQ1)39.8%38.3%
Interquartile 75% (IQ3)50.5%47.0%
Interquartile Range (IQR)10.8%8.7%
Standard Deviation (Sample)9.1%8.9%
Standard Deviation (Population)9.1%8.9%

Similar Demographics by Currently Married

Demographics Similar to Immigrants from Portugal by Currently Married

In terms of currently married, the demographic groups most similar to Immigrants from Portugal are Panamanian (45.3%, a difference of 0.12%), Kenyan (45.2%, a difference of 0.13%), Mexican (45.2%, a difference of 0.14%), Immigrants from the Azores (45.1%, a difference of 0.34%), and Immigrants from Thailand (45.4%, a difference of 0.36%).
DemographicsRating | RankCurrently Married
Marshallese
7.2
/100
|
#212
Tragic
45.5%
Alaska Natives
7.0
/100
|
#213
Tragic
45.5%
Dutch West Indians
6.7
/100
|
#214
Tragic
45.5%
German Russians
6.7
/100
|
#215
Tragic
45.5%
Immigrants | Morocco
5.5
/100
|
#216
Tragic
45.4%
Immigrants | Thailand
5.1
/100
|
#217
Tragic
45.4%
Panamanians
4.0
/100
|
#218
Tragic
45.3%
Immigrants | Portugal
3.5
/100
|
#219
Tragic
45.2%
Kenyans
3.1
/100
|
#220
Tragic
45.2%
Mexicans
3.0
/100
|
#221
Tragic
45.2%
Immigrants | Azores
2.5
/100
|
#222
Tragic
45.1%
Immigrants | Laos
2.3
/100
|
#223
Tragic
45.0%
Immigrants | Uganda
2.2
/100
|
#224
Tragic
45.0%
French American Indians
2.2
/100
|
#225
Tragic
45.0%
Comanche
2.1
/100
|
#226
Tragic
45.0%

Demographics Similar to Immigrants from Trinidad and Tobago by Currently Married

In terms of currently married, the demographic groups most similar to Immigrants from Trinidad and Tobago are Immigrants from Guyana (41.9%, a difference of 0.010%), Immigrants from Bahamas (41.9%, a difference of 0.030%), African (41.8%, a difference of 0.14%), Sioux (41.9%, a difference of 0.15%), and Immigrants from Zaire (42.0%, a difference of 0.16%).
DemographicsRating | RankCurrently Married
Immigrants | Honduras
0.0
/100
|
#298
Tragic
42.2%
Liberians
0.0
/100
|
#299
Tragic
42.2%
Belizeans
0.0
/100
|
#300
Tragic
42.2%
Immigrants | Yemen
0.0
/100
|
#301
Tragic
42.1%
Immigrants | Zaire
0.0
/100
|
#302
Tragic
42.0%
Sioux
0.0
/100
|
#303
Tragic
41.9%
Immigrants | Bahamas
0.0
/100
|
#304
Tragic
41.9%
Immigrants | Trinidad and Tobago
0.0
/100
|
#305
Tragic
41.9%
Immigrants | Guyana
0.0
/100
|
#306
Tragic
41.9%
Africans
0.0
/100
|
#307
Tragic
41.8%
Immigrants | Belize
0.0
/100
|
#308
Tragic
41.8%
Immigrants | Liberia
0.0
/100
|
#309
Tragic
41.8%
Guyanese
0.0
/100
|
#310
Tragic
41.6%
Trinidadians and Tobagonians
0.0
/100
|
#311
Tragic
41.5%
Somalis
0.0
/100
|
#312
Tragic
41.5%