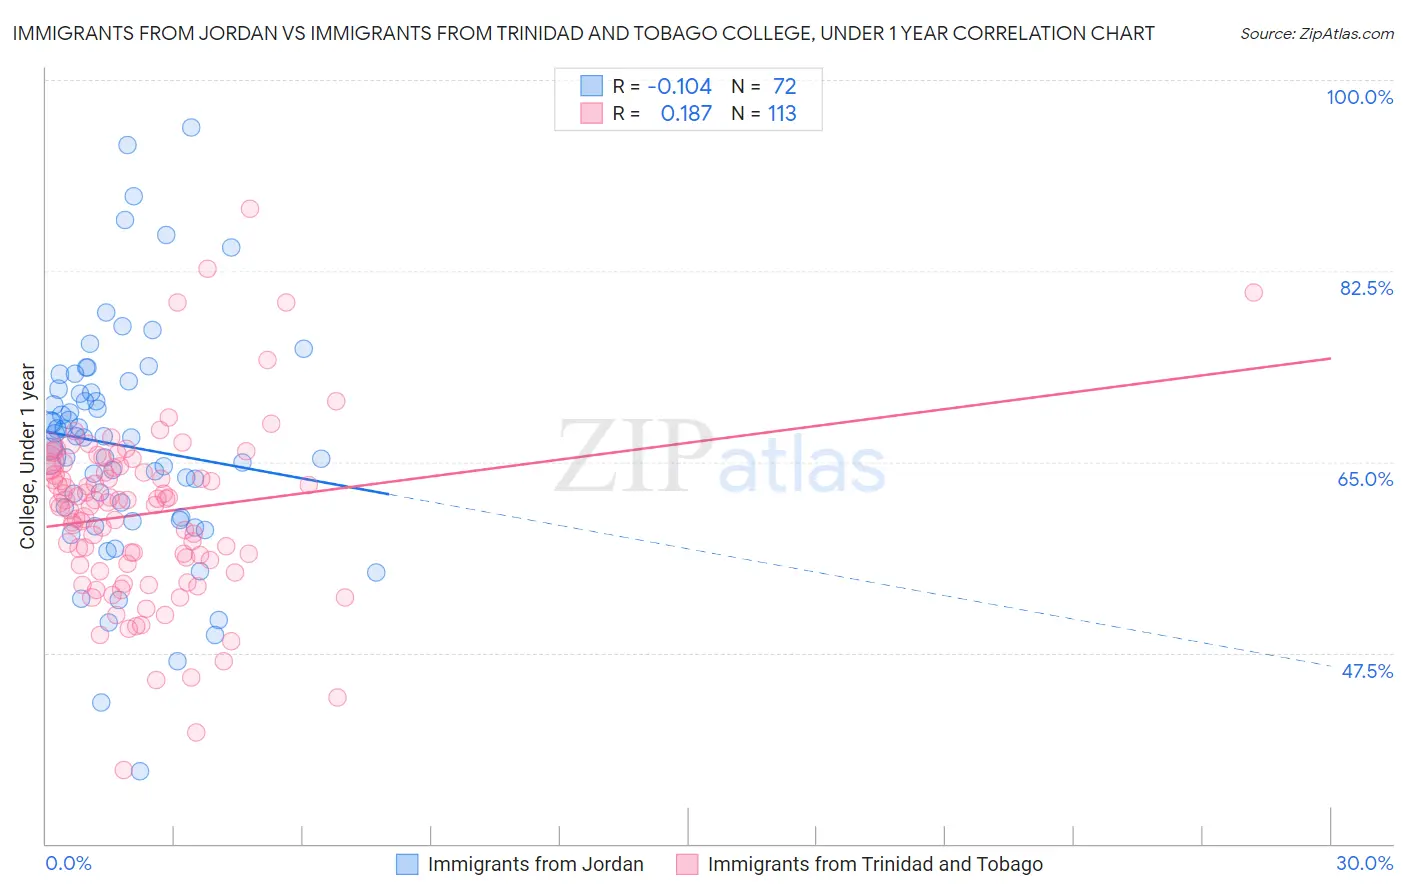
Immigrants from Jordan vs Immigrants from Trinidad and Tobago College, Under 1 year
COMPARE
Immigrants from Jordan
Immigrants from Trinidad and Tobago
College, Under 1 year
College, Under 1 year Comparison
Immigrants from Jordan
Immigrants from Trinidad and Tobago
67.3%
COLLEGE, UNDER 1 YEAR
92.8/ 100
METRIC RATING
122nd/ 347
METRIC RANK
60.7%
COLLEGE, UNDER 1 YEAR
0.1/ 100
METRIC RATING
268th/ 347
METRIC RANK
Immigrants from Jordan vs Immigrants from Trinidad and Tobago College, Under 1 year Correlation Chart
The statistical analysis conducted on geographies consisting of 181,278,834 people shows a poor negative correlation between the proportion of Immigrants from Jordan and percentage of population with at least college, under 1 year education in the United States with a correlation coefficient (R) of -0.104 and weighted average of 67.3%. Similarly, the statistical analysis conducted on geographies consisting of 223,526,872 people shows a poor positive correlation between the proportion of Immigrants from Trinidad and Tobago and percentage of population with at least college, under 1 year education in the United States with a correlation coefficient (R) of 0.187 and weighted average of 60.7%, a difference of 10.8%.
College, Under 1 year Correlation Summary
| Measurement | Immigrants from Jordan | Immigrants from Trinidad and Tobago |
| Minimum | 36.7% | 36.7% |
| Maximum | 95.6% | 88.2% |
| Range | 59.0% | 51.4% |
| Mean | 66.5% | 60.3% |
| Median | 67.2% | 61.2% |
| Interquartile 25% (IQ1) | 59.8% | 55.6% |
| Interquartile 75% (IQ3) | 71.5% | 64.6% |
| Interquartile Range (IQR) | 11.7% | 9.0% |
| Standard Deviation (Sample) | 10.8% | 8.0% |
| Standard Deviation (Population) | 10.7% | 8.0% |
Similar Demographics by College, Under 1 year
Demographics Similar to Immigrants from Jordan by College, Under 1 year
In terms of college, under 1 year, the demographic groups most similar to Immigrants from Jordan are Immigrants from Northern Africa (67.2%, a difference of 0.020%), Arab (67.2%, a difference of 0.030%), Slovene (67.3%, a difference of 0.090%), Italian (67.2%, a difference of 0.15%), and Serbian (67.4%, a difference of 0.18%).
| Demographics | Rating | Rank | College, Under 1 year |
| Basques | 95.2 /100 | #115 | Exceptional 67.6% |
| Immigrants | Nepal | 94.9 /100 | #116 | Exceptional 67.5% |
| Pakistanis | 94.8 /100 | #117 | Exceptional 67.5% |
| Immigrants | Ukraine | 94.7 /100 | #118 | Exceptional 67.5% |
| Lebanese | 94.6 /100 | #119 | Exceptional 67.5% |
| Serbians | 93.9 /100 | #120 | Exceptional 67.4% |
| Slovenes | 93.3 /100 | #121 | Exceptional 67.3% |
| Immigrants | Jordan | 92.8 /100 | #122 | Exceptional 67.3% |
| Immigrants | Northern Africa | 92.7 /100 | #123 | Exceptional 67.2% |
| Arabs | 92.6 /100 | #124 | Exceptional 67.2% |
| Italians | 91.8 /100 | #125 | Exceptional 67.2% |
| Alsatians | 91.3 /100 | #126 | Exceptional 67.1% |
| Czechs | 90.8 /100 | #127 | Exceptional 67.1% |
| Scottish | 90.2 /100 | #128 | Exceptional 67.0% |
| Immigrants | Eastern Africa | 89.5 /100 | #129 | Excellent 67.0% |
Demographics Similar to Immigrants from Trinidad and Tobago by College, Under 1 year
In terms of college, under 1 year, the demographic groups most similar to Immigrants from Trinidad and Tobago are Immigrants from West Indies (60.6%, a difference of 0.12%), Cheyenne (60.6%, a difference of 0.23%), U.S. Virgin Islander (60.6%, a difference of 0.24%), Jamaican (60.5%, a difference of 0.40%), and Chickasaw (60.4%, a difference of 0.44%).
| Demographics | Rating | Rank | College, Under 1 year |
| Africans | 0.3 /100 | #261 | Tragic 61.1% |
| Barbadians | 0.2 /100 | #262 | Tragic 61.1% |
| Shoshone | 0.2 /100 | #263 | Tragic 61.1% |
| Trinidadians and Tobagonians | 0.2 /100 | #264 | Tragic 61.1% |
| Immigrants | Bahamas | 0.2 /100 | #265 | Tragic 61.1% |
| Alaskan Athabascans | 0.2 /100 | #266 | Tragic 61.0% |
| Americans | 0.2 /100 | #267 | Tragic 61.0% |
| Immigrants | Trinidad and Tobago | 0.1 /100 | #268 | Tragic 60.7% |
| Immigrants | West Indies | 0.1 /100 | #269 | Tragic 60.6% |
| Cheyenne | 0.1 /100 | #270 | Tragic 60.6% |
| U.S. Virgin Islanders | 0.1 /100 | #271 | Tragic 60.6% |
| Jamaicans | 0.1 /100 | #272 | Tragic 60.5% |
| Chickasaw | 0.1 /100 | #273 | Tragic 60.4% |
| Alaska Natives | 0.1 /100 | #274 | Tragic 60.4% |
| Immigrants | Barbados | 0.1 /100 | #275 | Tragic 60.4% |