Immigrants from Philippines vs White/Caucasian 11th Grade
COMPARE
Immigrants from Philippines
White/Caucasian
11th Grade
11th Grade Comparison
Immigrants from Philippines
Whites/Caucasians
91.5%
11TH GRADE
1.0/ 100
METRIC RATING
247th/ 347
METRIC RANK
93.3%
11TH GRADE
97.4/ 100
METRIC RATING
117th/ 347
METRIC RANK
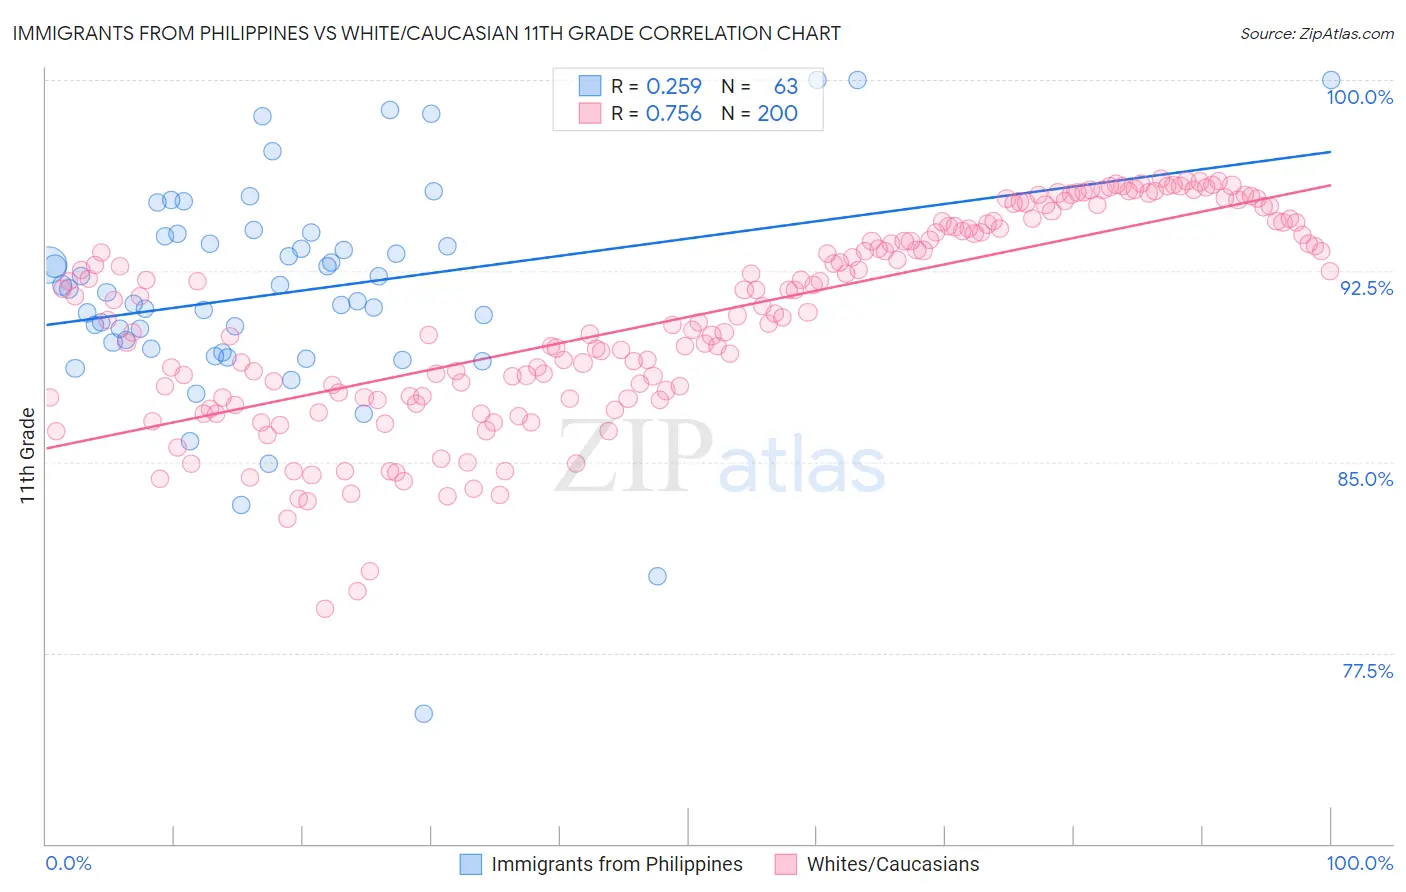
Immigrants from Philippines vs White/Caucasian 11th Grade Correlation Chart
The statistical analysis conducted on geographies consisting of 471,300,535 people shows a weak positive correlation between the proportion of Immigrants from Philippines and percentage of population with at least 11th grade education in the United States with a correlation coefficient (R) of 0.259 and weighted average of 91.5%. Similarly, the statistical analysis conducted on geographies consisting of 585,244,244 people shows a strong positive correlation between the proportion of Whites/Caucasians and percentage of population with at least 11th grade education in the United States with a correlation coefficient (R) of 0.756 and weighted average of 93.3%, a difference of 2.0%.
11th Grade Correlation Summary
| Measurement | Immigrants from Philippines | White/Caucasian |
| Minimum | 75.1% | 79.2% |
| Maximum | 100.0% | 96.1% |
| Range | 24.9% | 16.9% |
| Mean | 91.6% | 90.7% |
| Median | 91.7% | 91.0% |
| Interquartile 25% (IQ1) | 89.4% | 87.6% |
| Interquartile 75% (IQ3) | 93.9% | 94.2% |
| Interquartile Range (IQR) | 4.4% | 6.7% |
| Standard Deviation (Sample) | 4.3% | 4.0% |
| Standard Deviation (Population) | 4.3% | 3.9% |
Similar Demographics by 11th Grade
Demographics Similar to Immigrants from Philippines by 11th Grade
In terms of 11th grade, the demographic groups most similar to Immigrants from Philippines are Immigrants from Uzbekistan (91.5%, a difference of 0.0%), Peruvian (91.5%, a difference of 0.010%), Ghanaian (91.5%, a difference of 0.010%), Immigrants from Costa Rica (91.4%, a difference of 0.030%), and Seminole (91.5%, a difference of 0.040%).
| Demographics | Rating | Rank | 11th Grade |
| South Americans | 2.0 /100 | #240 | Tragic 91.6% |
| Bahamians | 1.8 /100 | #241 | Tragic 91.6% |
| Immigrants | Middle Africa | 1.6 /100 | #242 | Tragic 91.6% |
| Immigrants | Thailand | 1.4 /100 | #243 | Tragic 91.6% |
| Senegalese | 1.4 /100 | #244 | Tragic 91.6% |
| Africans | 1.3 /100 | #245 | Tragic 91.5% |
| Seminole | 1.2 /100 | #246 | Tragic 91.5% |
| Immigrants | Philippines | 1.0 /100 | #247 | Tragic 91.5% |
| Immigrants | Uzbekistan | 1.0 /100 | #248 | Tragic 91.5% |
| Peruvians | 1.0 /100 | #249 | Tragic 91.5% |
| Ghanaians | 0.9 /100 | #250 | Tragic 91.5% |
| Immigrants | Costa Rica | 0.9 /100 | #251 | Tragic 91.4% |
| Immigrants | Nigeria | 0.8 /100 | #252 | Tragic 91.4% |
| Immigrants | South America | 0.8 /100 | #253 | Tragic 91.4% |
| Immigrants | Eritrea | 0.7 /100 | #254 | Tragic 91.4% |
Demographics Similar to Whites/Caucasians by 11th Grade
In terms of 11th grade, the demographic groups most similar to Whites/Caucasians are Immigrants from Hungary (93.4%, a difference of 0.010%), Palestinian (93.4%, a difference of 0.030%), Jordanian (93.4%, a difference of 0.040%), Immigrants from Korea (93.3%, a difference of 0.040%), and Israeli (93.3%, a difference of 0.040%).
| Demographics | Rating | Rank | 11th Grade |
| Syrians | 98.4 /100 | #110 | Exceptional 93.4% |
| Yugoslavians | 98.1 /100 | #111 | Exceptional 93.4% |
| Immigrants | Germany | 98.0 /100 | #112 | Exceptional 93.4% |
| Immigrants | Zimbabwe | 97.8 /100 | #113 | Exceptional 93.4% |
| Jordanians | 97.8 /100 | #114 | Exceptional 93.4% |
| Palestinians | 97.7 /100 | #115 | Exceptional 93.4% |
| Immigrants | Hungary | 97.5 /100 | #116 | Exceptional 93.4% |
| Whites/Caucasians | 97.4 /100 | #117 | Exceptional 93.3% |
| Immigrants | Korea | 97.0 /100 | #118 | Exceptional 93.3% |
| Israelis | 97.0 /100 | #119 | Exceptional 93.3% |
| Immigrants | Russia | 96.6 /100 | #120 | Exceptional 93.3% |
| German Russians | 96.4 /100 | #121 | Exceptional 93.3% |
| Immigrants | Belarus | 96.3 /100 | #122 | Exceptional 93.3% |
| Immigrants | Greece | 95.9 /100 | #123 | Exceptional 93.2% |
| Immigrants | Eastern Europe | 95.9 /100 | #124 | Exceptional 93.2% |