Immigrants from Philippines vs Afghan 11th Grade
COMPARE
Immigrants from Philippines
Afghan
11th Grade
11th Grade Comparison
Immigrants from Philippines
Afghans
91.5%
11TH GRADE
1.0/ 100
METRIC RATING
247th/ 347
METRIC RANK
92.1%
11TH GRADE
12.8/ 100
METRIC RATING
214th/ 347
METRIC RANK
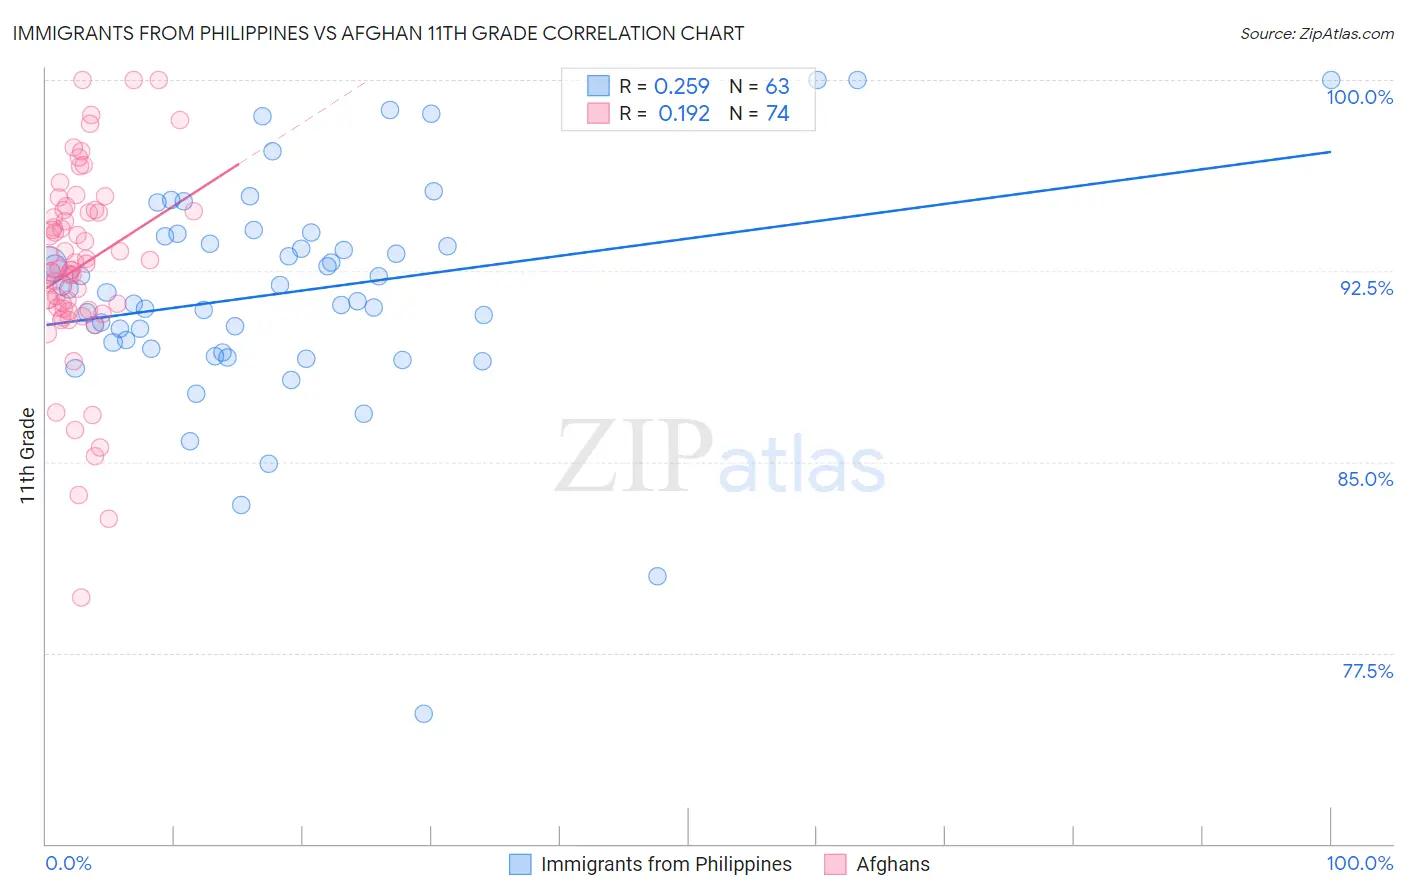
Immigrants from Philippines vs Afghan 11th Grade Correlation Chart
The statistical analysis conducted on geographies consisting of 471,300,535 people shows a weak positive correlation between the proportion of Immigrants from Philippines and percentage of population with at least 11th grade education in the United States with a correlation coefficient (R) of 0.259 and weighted average of 91.5%. Similarly, the statistical analysis conducted on geographies consisting of 148,851,685 people shows a poor positive correlation between the proportion of Afghans and percentage of population with at least 11th grade education in the United States with a correlation coefficient (R) of 0.192 and weighted average of 92.1%, a difference of 0.67%.
11th Grade Correlation Summary
| Measurement | Immigrants from Philippines | Afghan |
| Minimum | 75.1% | 79.7% |
| Maximum | 100.0% | 100.0% |
| Range | 24.9% | 20.3% |
| Mean | 91.6% | 92.7% |
| Median | 91.7% | 92.7% |
| Interquartile 25% (IQ1) | 89.4% | 91.0% |
| Interquartile 75% (IQ3) | 93.9% | 94.8% |
| Interquartile Range (IQR) | 4.4% | 3.8% |
| Standard Deviation (Sample) | 4.3% | 3.8% |
| Standard Deviation (Population) | 4.3% | 3.8% |
Similar Demographics by 11th Grade
Demographics Similar to Immigrants from Philippines by 11th Grade
In terms of 11th grade, the demographic groups most similar to Immigrants from Philippines are Immigrants from Uzbekistan (91.5%, a difference of 0.0%), Peruvian (91.5%, a difference of 0.010%), Ghanaian (91.5%, a difference of 0.010%), Immigrants from Costa Rica (91.4%, a difference of 0.030%), and Seminole (91.5%, a difference of 0.040%).
| Demographics | Rating | Rank | 11th Grade |
| South Americans | 2.0 /100 | #240 | Tragic 91.6% |
| Bahamians | 1.8 /100 | #241 | Tragic 91.6% |
| Immigrants | Middle Africa | 1.6 /100 | #242 | Tragic 91.6% |
| Immigrants | Thailand | 1.4 /100 | #243 | Tragic 91.6% |
| Senegalese | 1.4 /100 | #244 | Tragic 91.6% |
| Africans | 1.3 /100 | #245 | Tragic 91.5% |
| Seminole | 1.2 /100 | #246 | Tragic 91.5% |
| Immigrants | Philippines | 1.0 /100 | #247 | Tragic 91.5% |
| Immigrants | Uzbekistan | 1.0 /100 | #248 | Tragic 91.5% |
| Peruvians | 1.0 /100 | #249 | Tragic 91.5% |
| Ghanaians | 0.9 /100 | #250 | Tragic 91.5% |
| Immigrants | Costa Rica | 0.9 /100 | #251 | Tragic 91.4% |
| Immigrants | Nigeria | 0.8 /100 | #252 | Tragic 91.4% |
| Immigrants | South America | 0.8 /100 | #253 | Tragic 91.4% |
| Immigrants | Eritrea | 0.7 /100 | #254 | Tragic 91.4% |
Demographics Similar to Afghans by 11th Grade
In terms of 11th grade, the demographic groups most similar to Afghans are Immigrants from Southern Europe (92.1%, a difference of 0.010%), Immigrants from Ethiopia (92.1%, a difference of 0.020%), Korean (92.1%, a difference of 0.030%), Somali (92.1%, a difference of 0.030%), and Immigrants from Sierra Leone (92.0%, a difference of 0.040%).
| Demographics | Rating | Rank | 11th Grade |
| Immigrants | Oceania | 22.4 /100 | #207 | Fair 92.2% |
| Colville | 21.8 /100 | #208 | Fair 92.2% |
| Tongans | 19.8 /100 | #209 | Poor 92.2% |
| Ethiopians | 18.8 /100 | #210 | Poor 92.2% |
| Immigrants | Micronesia | 17.7 /100 | #211 | Poor 92.2% |
| Koreans | 14.4 /100 | #212 | Poor 92.1% |
| Immigrants | Ethiopia | 13.9 /100 | #213 | Poor 92.1% |
| Afghans | 12.8 /100 | #214 | Poor 92.1% |
| Immigrants | Southern Europe | 12.5 /100 | #215 | Poor 92.1% |
| Somalis | 11.6 /100 | #216 | Poor 92.1% |
| Immigrants | Sierra Leone | 11.1 /100 | #217 | Poor 92.0% |
| Blackfeet | 10.1 /100 | #218 | Poor 92.0% |
| Portuguese | 10.0 /100 | #219 | Tragic 92.0% |
| South American Indians | 7.6 /100 | #220 | Tragic 92.0% |
| Immigrants | Liberia | 7.0 /100 | #221 | Tragic 91.9% |