Immigrants from Panama vs Mexican 9th Grade
COMPARE
Immigrants from Panama
Mexican
9th Grade
9th Grade Comparison
Immigrants from Panama
Mexicans
94.3%
9TH GRADE
4.0/ 100
METRIC RATING
231st/ 347
METRIC RANK
90.0%
9TH GRADE
0.0/ 100
METRIC RATING
340th/ 347
METRIC RANK
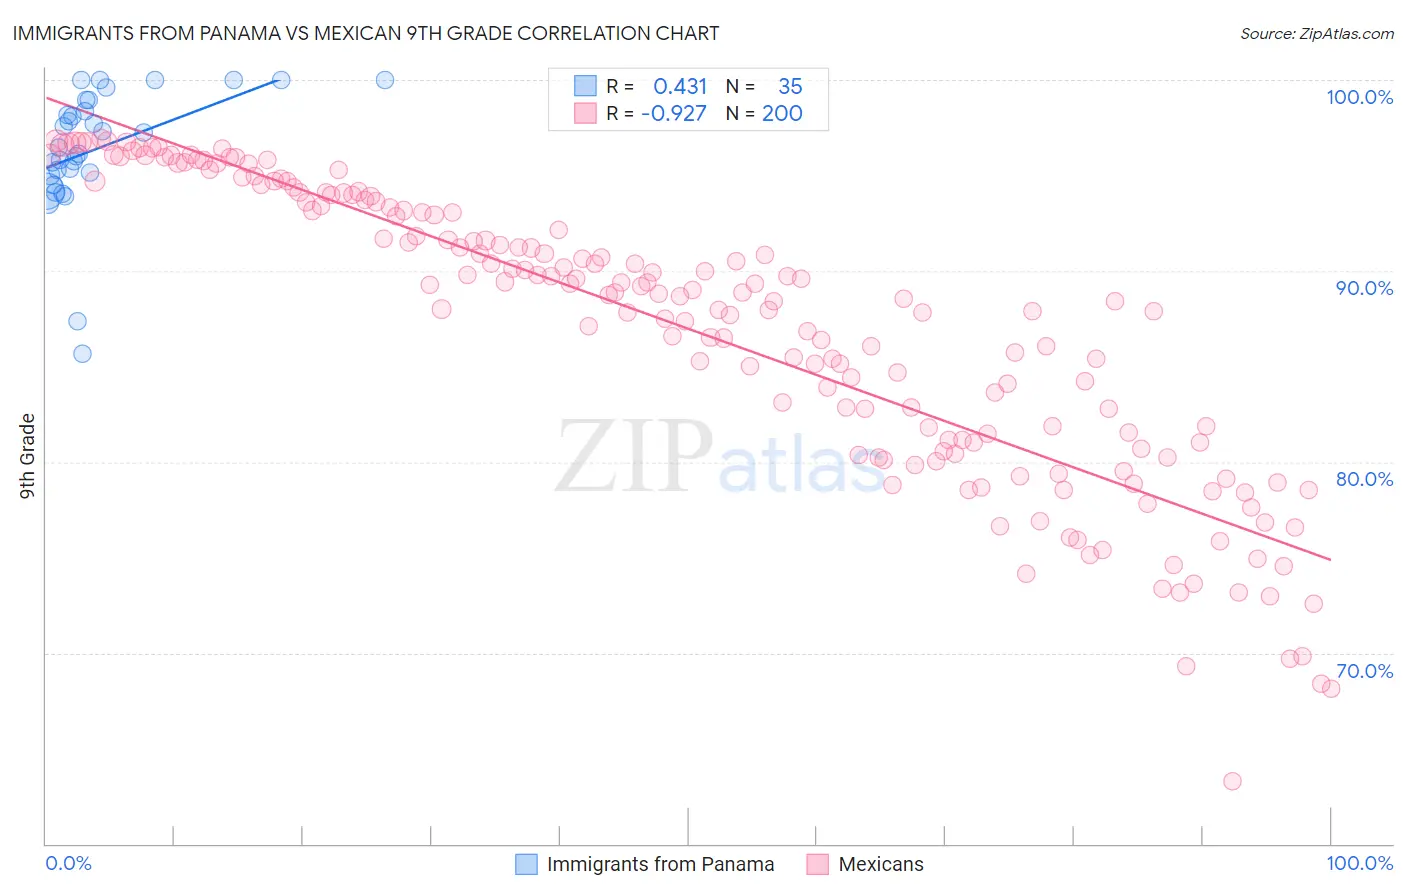
Immigrants from Panama vs Mexican 9th Grade Correlation Chart
The statistical analysis conducted on geographies consisting of 221,183,192 people shows a moderate positive correlation between the proportion of Immigrants from Panama and percentage of population with at least 9th grade education in the United States with a correlation coefficient (R) of 0.431 and weighted average of 94.3%. Similarly, the statistical analysis conducted on geographies consisting of 565,339,264 people shows a near-perfect negative correlation between the proportion of Mexicans and percentage of population with at least 9th grade education in the United States with a correlation coefficient (R) of -0.927 and weighted average of 90.0%, a difference of 4.8%.
9th Grade Correlation Summary
| Measurement | Immigrants from Panama | Mexican |
| Minimum | 85.7% | 63.2% |
| Maximum | 100.0% | 96.9% |
| Range | 14.3% | 33.7% |
| Mean | 96.4% | 87.0% |
| Median | 96.5% | 88.8% |
| Interquartile 25% (IQ1) | 95.0% | 81.0% |
| Interquartile 75% (IQ3) | 98.9% | 93.5% |
| Interquartile Range (IQR) | 3.9% | 12.5% |
| Standard Deviation (Sample) | 3.2% | 7.6% |
| Standard Deviation (Population) | 3.2% | 7.5% |
Similar Demographics by 9th Grade
Demographics Similar to Immigrants from Panama by 9th Grade
In terms of 9th grade, the demographic groups most similar to Immigrants from Panama are Apache (94.3%, a difference of 0.010%), Immigrants from Africa (94.3%, a difference of 0.010%), Immigrants from Southern Europe (94.3%, a difference of 0.020%), Nigerian (94.3%, a difference of 0.020%), and Costa Rican (94.3%, a difference of 0.020%).
| Demographics | Rating | Rank | 9th Grade |
| Tongans | 6.0 /100 | #224 | Tragic 94.4% |
| Ethiopians | 5.4 /100 | #225 | Tragic 94.4% |
| Sub-Saharan Africans | 5.4 /100 | #226 | Tragic 94.4% |
| Immigrants | Sierra Leone | 4.8 /100 | #227 | Tragic 94.4% |
| Lumbee | 4.7 /100 | #228 | Tragic 94.4% |
| Immigrants | Southern Europe | 4.5 /100 | #229 | Tragic 94.3% |
| Apache | 4.2 /100 | #230 | Tragic 94.3% |
| Immigrants | Panama | 4.0 /100 | #231 | Tragic 94.3% |
| Immigrants | Africa | 3.9 /100 | #232 | Tragic 94.3% |
| Nigerians | 3.7 /100 | #233 | Tragic 94.3% |
| Costa Ricans | 3.5 /100 | #234 | Tragic 94.3% |
| Bolivians | 3.3 /100 | #235 | Tragic 94.3% |
| Somalis | 2.9 /100 | #236 | Tragic 94.3% |
| Koreans | 2.9 /100 | #237 | Tragic 94.3% |
| South American Indians | 2.8 /100 | #238 | Tragic 94.3% |
Demographics Similar to Mexicans by 9th Grade
In terms of 9th grade, the demographic groups most similar to Mexicans are Yakama (90.1%, a difference of 0.060%), Guatemalan (89.9%, a difference of 0.13%), Central American (90.4%, a difference of 0.40%), Immigrants from Latin America (90.4%, a difference of 0.41%), and Salvadoran (89.6%, a difference of 0.43%).
| Demographics | Rating | Rank | 9th Grade |
| Immigrants | Yemen | 0.0 /100 | #333 | Tragic 90.8% |
| Immigrants | Azores | 0.0 /100 | #334 | Tragic 90.8% |
| Immigrants | Honduras | 0.0 /100 | #335 | Tragic 90.6% |
| Immigrants | Dominican Republic | 0.0 /100 | #336 | Tragic 90.5% |
| Immigrants | Latin America | 0.0 /100 | #337 | Tragic 90.4% |
| Central Americans | 0.0 /100 | #338 | Tragic 90.4% |
| Yakama | 0.0 /100 | #339 | Tragic 90.1% |
| Mexicans | 0.0 /100 | #340 | Tragic 90.0% |
| Guatemalans | 0.0 /100 | #341 | Tragic 89.9% |
| Salvadorans | 0.0 /100 | #342 | Tragic 89.6% |
| Immigrants | Guatemala | 0.0 /100 | #343 | Tragic 89.4% |
| Immigrants | El Salvador | 0.0 /100 | #344 | Tragic 89.0% |
| Immigrants | Central America | 0.0 /100 | #345 | Tragic 89.0% |
| Immigrants | Mexico | 0.0 /100 | #346 | Tragic 88.7% |
| Spanish American Indians | 0.0 /100 | #347 | Tragic 88.3% |