Immigrants from Panama vs Moroccan 9th Grade
COMPARE
Immigrants from Panama
Moroccan
9th Grade
9th Grade Comparison
Immigrants from Panama
Moroccans
94.3%
9TH GRADE
4.0/ 100
METRIC RATING
231st/ 347
METRIC RANK
94.6%
9TH GRADE
19.6/ 100
METRIC RATING
204th/ 347
METRIC RANK
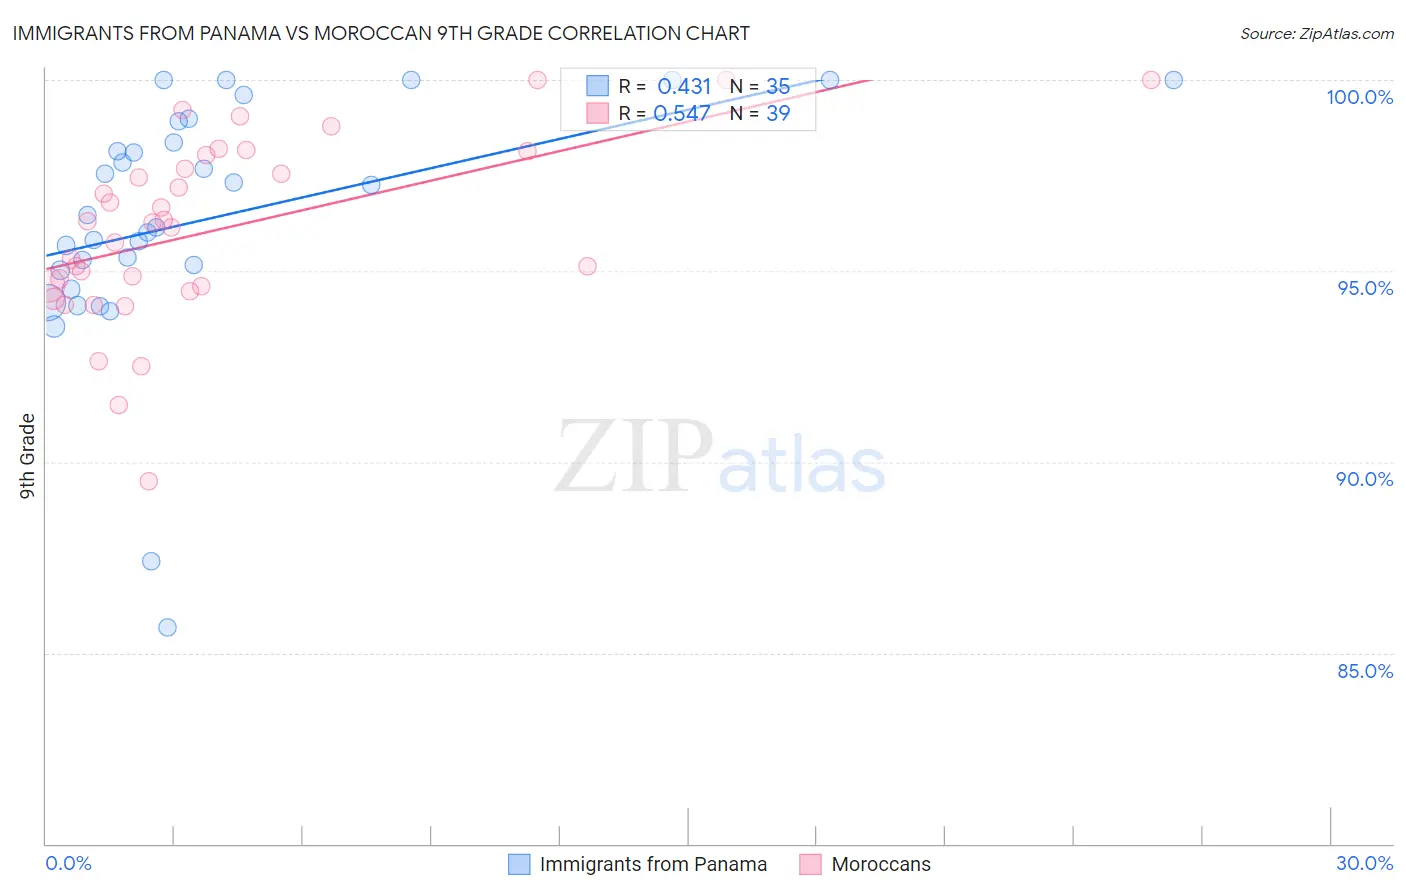
Immigrants from Panama vs Moroccan 9th Grade Correlation Chart
The statistical analysis conducted on geographies consisting of 221,183,192 people shows a moderate positive correlation between the proportion of Immigrants from Panama and percentage of population with at least 9th grade education in the United States with a correlation coefficient (R) of 0.431 and weighted average of 94.3%. Similarly, the statistical analysis conducted on geographies consisting of 201,817,667 people shows a substantial positive correlation between the proportion of Moroccans and percentage of population with at least 9th grade education in the United States with a correlation coefficient (R) of 0.547 and weighted average of 94.6%, a difference of 0.33%.
9th Grade Correlation Summary
| Measurement | Immigrants from Panama | Moroccan |
| Minimum | 85.7% | 89.5% |
| Maximum | 100.0% | 100.0% |
| Range | 14.3% | 10.5% |
| Mean | 96.4% | 96.1% |
| Median | 96.5% | 96.3% |
| Interquartile 25% (IQ1) | 95.0% | 94.6% |
| Interquartile 75% (IQ3) | 98.9% | 98.0% |
| Interquartile Range (IQR) | 3.9% | 3.4% |
| Standard Deviation (Sample) | 3.2% | 2.4% |
| Standard Deviation (Population) | 3.2% | 2.4% |
Similar Demographics by 9th Grade
Demographics Similar to Immigrants from Panama by 9th Grade
In terms of 9th grade, the demographic groups most similar to Immigrants from Panama are Apache (94.3%, a difference of 0.010%), Immigrants from Africa (94.3%, a difference of 0.010%), Immigrants from Southern Europe (94.3%, a difference of 0.020%), Nigerian (94.3%, a difference of 0.020%), and Costa Rican (94.3%, a difference of 0.020%).
| Demographics | Rating | Rank | 9th Grade |
| Tongans | 6.0 /100 | #224 | Tragic 94.4% |
| Ethiopians | 5.4 /100 | #225 | Tragic 94.4% |
| Sub-Saharan Africans | 5.4 /100 | #226 | Tragic 94.4% |
| Immigrants | Sierra Leone | 4.8 /100 | #227 | Tragic 94.4% |
| Lumbee | 4.7 /100 | #228 | Tragic 94.4% |
| Immigrants | Southern Europe | 4.5 /100 | #229 | Tragic 94.3% |
| Apache | 4.2 /100 | #230 | Tragic 94.3% |
| Immigrants | Panama | 4.0 /100 | #231 | Tragic 94.3% |
| Immigrants | Africa | 3.9 /100 | #232 | Tragic 94.3% |
| Nigerians | 3.7 /100 | #233 | Tragic 94.3% |
| Costa Ricans | 3.5 /100 | #234 | Tragic 94.3% |
| Bolivians | 3.3 /100 | #235 | Tragic 94.3% |
| Somalis | 2.9 /100 | #236 | Tragic 94.3% |
| Koreans | 2.9 /100 | #237 | Tragic 94.3% |
| South American Indians | 2.8 /100 | #238 | Tragic 94.3% |
Demographics Similar to Moroccans by 9th Grade
In terms of 9th grade, the demographic groups most similar to Moroccans are Immigrants from Eastern Asia (94.6%, a difference of 0.0%), Immigrants from Bahamas (94.6%, a difference of 0.0%), Immigrants from Zaire (94.6%, a difference of 0.010%), Black/African American (94.6%, a difference of 0.010%), and Laotian (94.6%, a difference of 0.020%).
| Demographics | Rating | Rank | 9th Grade |
| Immigrants | Micronesia | 24.7 /100 | #197 | Fair 94.7% |
| Hawaiians | 22.7 /100 | #198 | Fair 94.7% |
| Laotians | 21.0 /100 | #199 | Fair 94.6% |
| Immigrants | Zaire | 20.6 /100 | #200 | Fair 94.6% |
| Blacks/African Americans | 20.5 /100 | #201 | Fair 94.6% |
| Immigrants | Eastern Asia | 19.8 /100 | #202 | Poor 94.6% |
| Immigrants | Bahamas | 19.8 /100 | #203 | Poor 94.6% |
| Moroccans | 19.6 /100 | #204 | Poor 94.6% |
| Immigrants | Sudan | 17.6 /100 | #205 | Poor 94.6% |
| Samoans | 17.3 /100 | #206 | Poor 94.6% |
| Immigrants | Morocco | 16.3 /100 | #207 | Poor 94.6% |
| Immigrants | Pakistan | 15.5 /100 | #208 | Poor 94.6% |
| Comanche | 14.9 /100 | #209 | Poor 94.6% |
| Immigrants | Chile | 13.4 /100 | #210 | Poor 94.5% |
| Immigrants | Indonesia | 12.3 /100 | #211 | Poor 94.5% |