Immigrants from Pakistan vs Puerto Rican Unemployment Among Ages 20 to 24 years
COMPARE
Immigrants from Pakistan
Puerto Rican
Unemployment Among Ages 20 to 24 years
Unemployment Among Ages 20 to 24 years Comparison
Immigrants from Pakistan
Puerto Ricans
10.6%
UNEMPLOYMENT AMONG AGES 20 TO 24 YEARS
2.6/ 100
METRIC RATING
238th/ 347
METRIC RANK
16.7%
UNEMPLOYMENT AMONG AGES 20 TO 24 YEARS
0.0/ 100
METRIC RATING
342nd/ 347
METRIC RANK
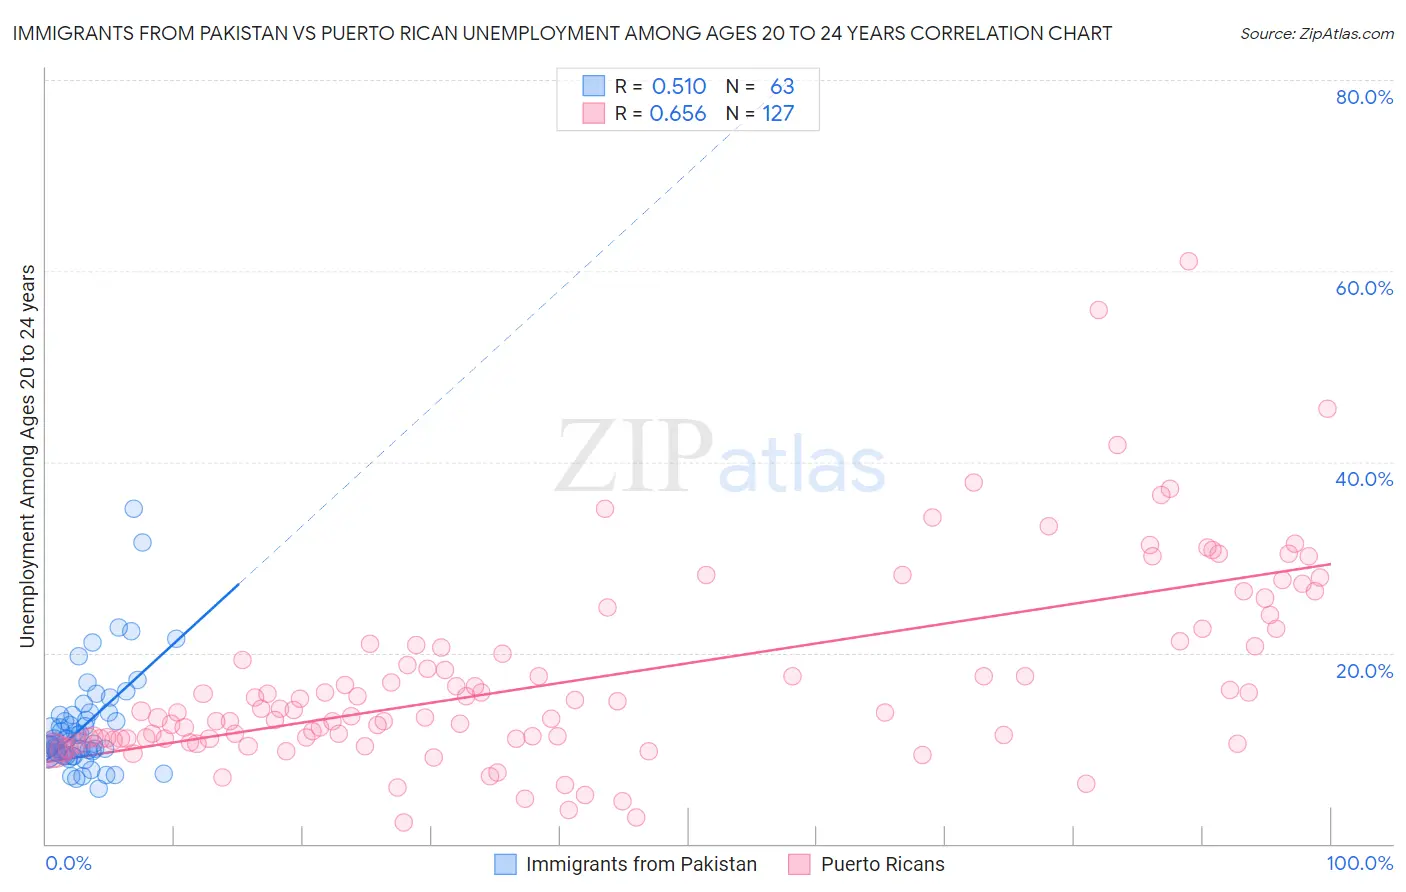
Immigrants from Pakistan vs Puerto Rican Unemployment Among Ages 20 to 24 years Correlation Chart
The statistical analysis conducted on geographies consisting of 279,854,860 people shows a substantial positive correlation between the proportion of Immigrants from Pakistan and unemployment rate among population between the ages 20 and 24 in the United States with a correlation coefficient (R) of 0.510 and weighted average of 10.6%. Similarly, the statistical analysis conducted on geographies consisting of 498,686,808 people shows a significant positive correlation between the proportion of Puerto Ricans and unemployment rate among population between the ages 20 and 24 in the United States with a correlation coefficient (R) of 0.656 and weighted average of 16.7%, a difference of 56.4%.
Unemployment Among Ages 20 to 24 years Correlation Summary
| Measurement | Immigrants from Pakistan | Puerto Rican |
| Minimum | 5.8% | 2.3% |
| Maximum | 35.1% | 61.0% |
| Range | 29.3% | 58.7% |
| Mean | 12.4% | 17.3% |
| Median | 10.6% | 13.9% |
| Interquartile 25% (IQ1) | 9.3% | 11.0% |
| Interquartile 75% (IQ3) | 13.5% | 21.0% |
| Interquartile Range (IQR) | 4.3% | 10.0% |
| Standard Deviation (Sample) | 5.4% | 10.2% |
| Standard Deviation (Population) | 5.4% | 10.1% |
Similar Demographics by Unemployment Among Ages 20 to 24 years
Demographics Similar to Immigrants from Pakistan by Unemployment Among Ages 20 to 24 years
In terms of unemployment among ages 20 to 24 years, the demographic groups most similar to Immigrants from Pakistan are Immigrants (10.6%, a difference of 0.020%), Salvadoran (10.7%, a difference of 0.060%), Mexican (10.6%, a difference of 0.19%), Immigrants from Ukraine (10.6%, a difference of 0.23%), and Immigrants from Central America (10.7%, a difference of 0.25%).
| Demographics | Rating | Rank | Unemployment Among Ages 20 to 24 years |
| Native Hawaiians | 3.9 /100 | #231 | Tragic 10.6% |
| Israelis | 3.7 /100 | #232 | Tragic 10.6% |
| Choctaw | 3.6 /100 | #233 | Tragic 10.6% |
| Immigrants | Africa | 3.5 /100 | #234 | Tragic 10.6% |
| Immigrants | Ukraine | 3.3 /100 | #235 | Tragic 10.6% |
| Mexicans | 3.2 /100 | #236 | Tragic 10.6% |
| Immigrants | Immigrants | 2.7 /100 | #237 | Tragic 10.6% |
| Immigrants | Pakistan | 2.6 /100 | #238 | Tragic 10.6% |
| Salvadorans | 2.4 /100 | #239 | Tragic 10.7% |
| Immigrants | Central America | 2.0 /100 | #240 | Tragic 10.7% |
| Immigrants | El Salvador | 1.7 /100 | #241 | Tragic 10.7% |
| Moroccans | 1.4 /100 | #242 | Tragic 10.7% |
| Immigrants | Belarus | 1.3 /100 | #243 | Tragic 10.7% |
| Immigrants | Mexico | 1.2 /100 | #244 | Tragic 10.7% |
| Hispanics or Latinos | 1.0 /100 | #245 | Tragic 10.7% |
Demographics Similar to Puerto Ricans by Unemployment Among Ages 20 to 24 years
In terms of unemployment among ages 20 to 24 years, the demographic groups most similar to Puerto Ricans are Navajo (16.1%, a difference of 3.2%), Yuman (15.8%, a difference of 5.1%), Tsimshian (18.0%, a difference of 8.0%), Immigrants from Yemen (14.9%, a difference of 11.9%), and Crow (18.7%, a difference of 12.5%).
| Demographics | Rating | Rank | Unemployment Among Ages 20 to 24 years |
| Immigrants | Guyana | 0.0 /100 | #333 | Tragic 13.9% |
| Guyanese | 0.0 /100 | #334 | Tragic 14.0% |
| Sioux | 0.0 /100 | #335 | Tragic 14.2% |
| Pima | 0.0 /100 | #336 | Tragic 14.2% |
| Paiute | 0.0 /100 | #337 | Tragic 14.3% |
| Immigrants | St. Vincent and the Grenadines | 0.0 /100 | #338 | Tragic 14.3% |
| Immigrants | Yemen | 0.0 /100 | #339 | Tragic 14.9% |
| Yuman | 0.0 /100 | #340 | Tragic 15.8% |
| Navajo | 0.0 /100 | #341 | Tragic 16.1% |
| Puerto Ricans | 0.0 /100 | #342 | Tragic 16.7% |
| Tsimshian | 0.0 /100 | #343 | Tragic 18.0% |
| Crow | 0.0 /100 | #344 | Tragic 18.7% |
| Hopi | 0.0 /100 | #345 | Tragic 19.9% |
| Yup'ik | 0.0 /100 | #346 | Tragic 20.9% |
| Inupiat | 0.0 /100 | #347 | Tragic 20.9% |