Immigrants from Pakistan vs Australian College, Under 1 year
COMPARE
Immigrants from Pakistan
Australian
College, Under 1 year
College, Under 1 year Comparison
Immigrants from Pakistan
Australians
68.0%
COLLEGE, UNDER 1 YEAR
97.5/ 100
METRIC RATING
95th/ 347
METRIC RANK
70.4%
COLLEGE, UNDER 1 YEAR
99.9/ 100
METRIC RATING
38th/ 347
METRIC RANK
Immigrants from Pakistan vs Australian College, Under 1 year Correlation Chart
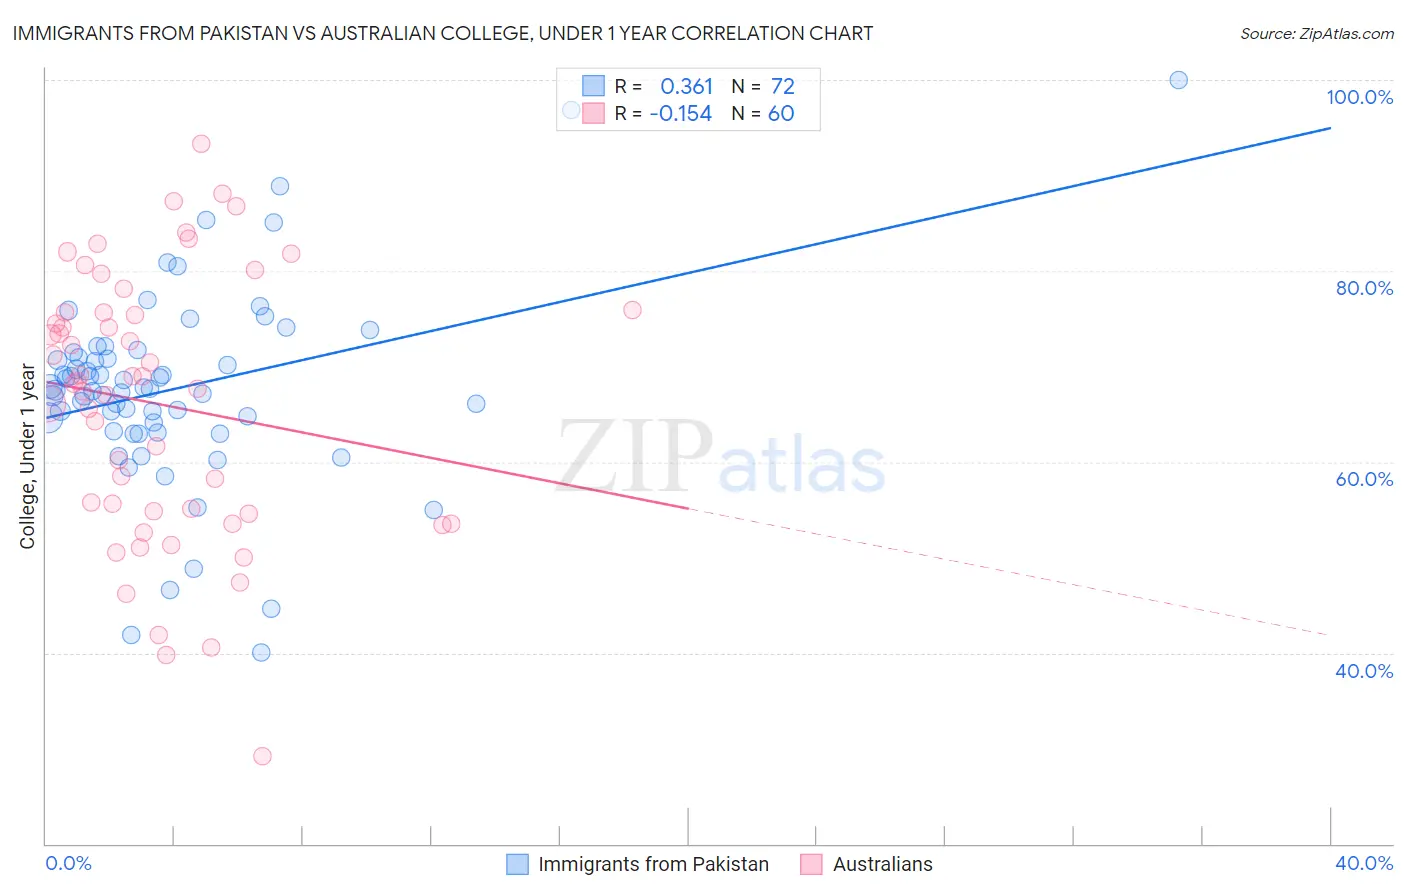
The statistical analysis conducted on geographies consisting of 283,911,472 people shows a mild positive correlation between the proportion of Immigrants from Pakistan and percentage of population with at least college, under 1 year education in the United States with a correlation coefficient (R) of 0.361 and weighted average of 68.0%. Similarly, the statistical analysis conducted on geographies consisting of 224,162,526 people shows a poor negative correlation between the proportion of Australians and percentage of population with at least college, under 1 year education in the United States with a correlation coefficient (R) of -0.154 and weighted average of 70.4%, a difference of 3.4%.
College, Under 1 year Correlation Summary
| Measurement | Immigrants from Pakistan | Australian |
| Minimum | 40.0% | 29.1% |
| Maximum | 100.0% | 93.4% |
| Range | 60.0% | 64.2% |
| Mean | 67.7% | 66.0% |
| Median | 67.6% | 68.3% |
| Interquartile 25% (IQ1) | 63.6% | 54.7% |
| Interquartile 75% (IQ3) | 71.2% | 75.6% |
| Interquartile Range (IQR) | 7.6% | 21.0% |
| Standard Deviation (Sample) | 10.3% | 14.0% |
| Standard Deviation (Population) | 10.2% | 13.8% |
Similar Demographics by College, Under 1 year
Demographics Similar to Immigrants from Pakistan by College, Under 1 year
In terms of college, under 1 year, the demographic groups most similar to Immigrants from Pakistan are Jordanian (68.0%, a difference of 0.030%), Immigrants from Ethiopia (68.0%, a difference of 0.060%), Armenian (68.1%, a difference of 0.090%), Paraguayan (67.9%, a difference of 0.17%), and Immigrants from Bolivia (67.9%, a difference of 0.18%).
| Demographics | Rating | Rank | College, Under 1 year |
| Croatians | 98.2 /100 | #88 | Exceptional 68.3% |
| Ethiopians | 98.2 /100 | #89 | Exceptional 68.3% |
| Icelanders | 98.1 /100 | #90 | Exceptional 68.3% |
| Europeans | 98.1 /100 | #91 | Exceptional 68.2% |
| Luxembourgers | 98.1 /100 | #92 | Exceptional 68.2% |
| Romanians | 97.9 /100 | #93 | Exceptional 68.2% |
| Armenians | 97.7 /100 | #94 | Exceptional 68.1% |
| Immigrants | Pakistan | 97.5 /100 | #95 | Exceptional 68.0% |
| Jordanians | 97.4 /100 | #96 | Exceptional 68.0% |
| Immigrants | Ethiopia | 97.3 /100 | #97 | Exceptional 68.0% |
| Paraguayans | 97.1 /100 | #98 | Exceptional 67.9% |
| Immigrants | Bolivia | 97.0 /100 | #99 | Exceptional 67.9% |
| Immigrants | Argentina | 97.0 /100 | #100 | Exceptional 67.9% |
| Immigrants | Eastern Europe | 96.9 /100 | #101 | Exceptional 67.9% |
| Palestinians | 96.9 /100 | #102 | Exceptional 67.9% |
Demographics Similar to Australians by College, Under 1 year
In terms of college, under 1 year, the demographic groups most similar to Australians are Bhutanese (70.3%, a difference of 0.020%), Immigrants from Turkey (70.3%, a difference of 0.030%), Immigrants from Saudi Arabia (70.4%, a difference of 0.070%), Immigrants from Kuwait (70.3%, a difference of 0.070%), and Immigrants from Lithuania (70.3%, a difference of 0.11%).
| Demographics | Rating | Rank | College, Under 1 year |
| Indians (Asian) | 99.9 /100 | #31 | Exceptional 70.8% |
| Turks | 99.9 /100 | #32 | Exceptional 70.7% |
| Immigrants | South Africa | 99.9 /100 | #33 | Exceptional 70.6% |
| Estonians | 99.9 /100 | #34 | Exceptional 70.6% |
| Russians | 99.9 /100 | #35 | Exceptional 70.5% |
| Immigrants | Sri Lanka | 99.9 /100 | #36 | Exceptional 70.5% |
| Immigrants | Saudi Arabia | 99.9 /100 | #37 | Exceptional 70.4% |
| Australians | 99.9 /100 | #38 | Exceptional 70.4% |
| Bhutanese | 99.9 /100 | #39 | Exceptional 70.3% |
| Immigrants | Turkey | 99.9 /100 | #40 | Exceptional 70.3% |
| Immigrants | Kuwait | 99.9 /100 | #41 | Exceptional 70.3% |
| Immigrants | Lithuania | 99.9 /100 | #42 | Exceptional 70.3% |
| Israelis | 99.9 /100 | #43 | Exceptional 70.2% |
| New Zealanders | 99.9 /100 | #44 | Exceptional 70.2% |
| Immigrants | Norway | 99.9 /100 | #45 | Exceptional 70.2% |