Immigrants from Pakistan vs Osage College, Under 1 year
COMPARE
Immigrants from Pakistan
Osage
College, Under 1 year
College, Under 1 year Comparison
Immigrants from Pakistan
Osage
68.0%
COLLEGE, UNDER 1 YEAR
97.5/ 100
METRIC RATING
95th/ 347
METRIC RANK
62.7%
COLLEGE, UNDER 1 YEAR
2.2/ 100
METRIC RATING
232nd/ 347
METRIC RANK
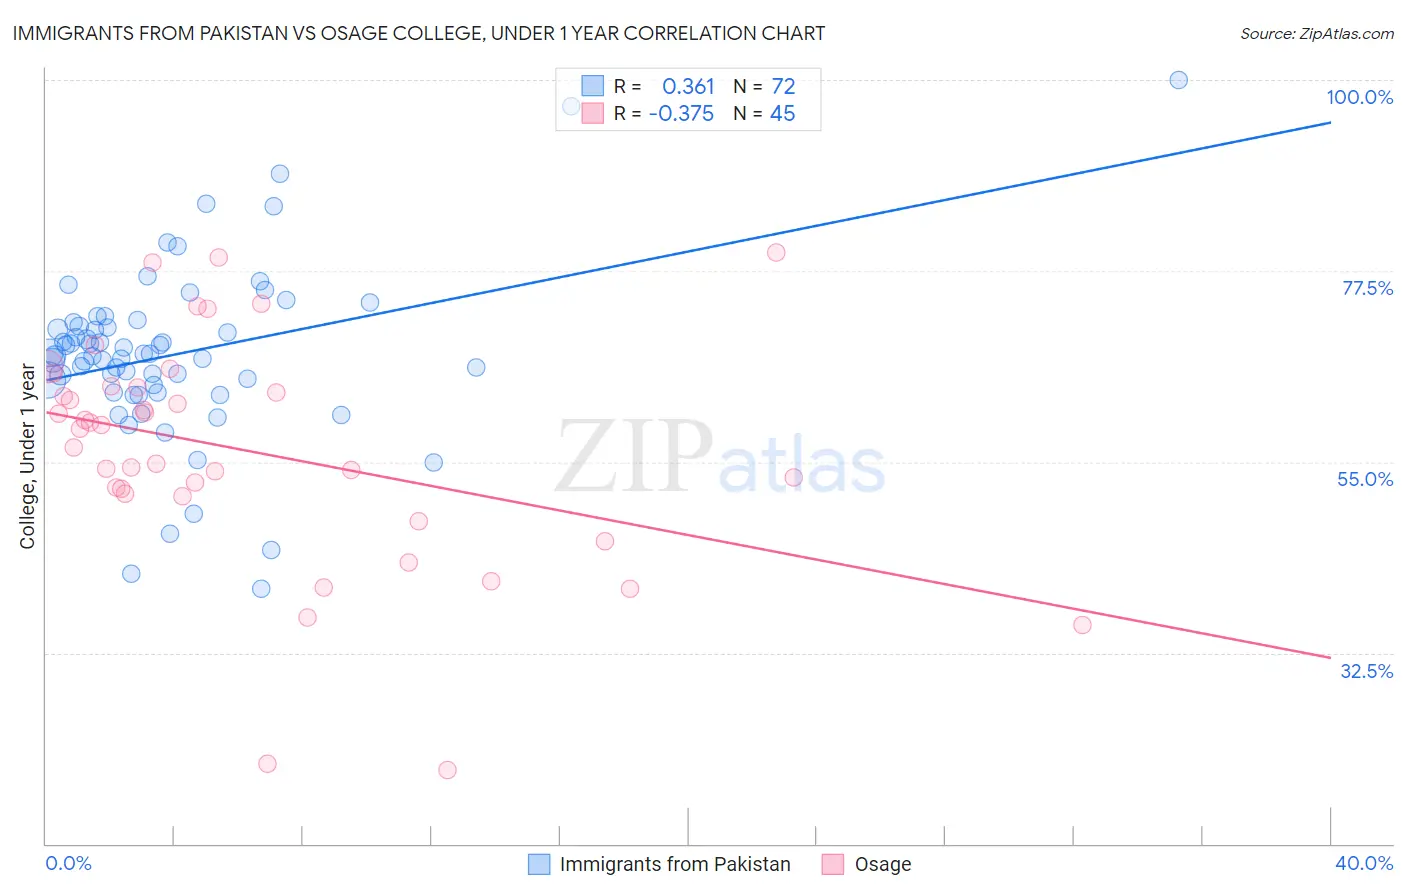
Immigrants from Pakistan vs Osage College, Under 1 year Correlation Chart
The statistical analysis conducted on geographies consisting of 283,911,472 people shows a mild positive correlation between the proportion of Immigrants from Pakistan and percentage of population with at least college, under 1 year education in the United States with a correlation coefficient (R) of 0.361 and weighted average of 68.0%. Similarly, the statistical analysis conducted on geographies consisting of 91,808,929 people shows a mild negative correlation between the proportion of Osage and percentage of population with at least college, under 1 year education in the United States with a correlation coefficient (R) of -0.375 and weighted average of 62.7%, a difference of 8.5%.
College, Under 1 year Correlation Summary
| Measurement | Immigrants from Pakistan | Osage |
| Minimum | 40.0% | 18.8% |
| Maximum | 100.0% | 79.7% |
| Range | 60.0% | 60.9% |
| Mean | 67.7% | 56.2% |
| Median | 67.6% | 58.9% |
| Interquartile 25% (IQ1) | 63.6% | 51.1% |
| Interquartile 75% (IQ3) | 71.2% | 63.8% |
| Interquartile Range (IQR) | 7.6% | 12.7% |
| Standard Deviation (Sample) | 10.3% | 13.5% |
| Standard Deviation (Population) | 10.2% | 13.4% |
Similar Demographics by College, Under 1 year
Demographics Similar to Immigrants from Pakistan by College, Under 1 year
In terms of college, under 1 year, the demographic groups most similar to Immigrants from Pakistan are Jordanian (68.0%, a difference of 0.030%), Immigrants from Ethiopia (68.0%, a difference of 0.060%), Armenian (68.1%, a difference of 0.090%), Paraguayan (67.9%, a difference of 0.17%), and Immigrants from Bolivia (67.9%, a difference of 0.18%).
| Demographics | Rating | Rank | College, Under 1 year |
| Croatians | 98.2 /100 | #88 | Exceptional 68.3% |
| Ethiopians | 98.2 /100 | #89 | Exceptional 68.3% |
| Icelanders | 98.1 /100 | #90 | Exceptional 68.3% |
| Europeans | 98.1 /100 | #91 | Exceptional 68.2% |
| Luxembourgers | 98.1 /100 | #92 | Exceptional 68.2% |
| Romanians | 97.9 /100 | #93 | Exceptional 68.2% |
| Armenians | 97.7 /100 | #94 | Exceptional 68.1% |
| Immigrants | Pakistan | 97.5 /100 | #95 | Exceptional 68.0% |
| Jordanians | 97.4 /100 | #96 | Exceptional 68.0% |
| Immigrants | Ethiopia | 97.3 /100 | #97 | Exceptional 68.0% |
| Paraguayans | 97.1 /100 | #98 | Exceptional 67.9% |
| Immigrants | Bolivia | 97.0 /100 | #99 | Exceptional 67.9% |
| Immigrants | Argentina | 97.0 /100 | #100 | Exceptional 67.9% |
| Immigrants | Eastern Europe | 96.9 /100 | #101 | Exceptional 67.9% |
| Palestinians | 96.9 /100 | #102 | Exceptional 67.9% |
Demographics Similar to Osage by College, Under 1 year
In terms of college, under 1 year, the demographic groups most similar to Osage are Immigrants from Western Africa (62.8%, a difference of 0.11%), Iroquois (62.6%, a difference of 0.12%), Chippewa (62.6%, a difference of 0.15%), Spanish American (62.6%, a difference of 0.20%), and Immigrants (62.5%, a difference of 0.33%).
| Demographics | Rating | Rank | College, Under 1 year |
| Immigrants | Peru | 4.0 /100 | #225 | Tragic 63.1% |
| Immigrants | Colombia | 4.0 /100 | #226 | Tragic 63.1% |
| Immigrants | Ghana | 3.7 /100 | #227 | Tragic 63.1% |
| Samoans | 3.3 /100 | #228 | Tragic 63.0% |
| Liberians | 3.2 /100 | #229 | Tragic 63.0% |
| Immigrants | Nonimmigrants | 3.0 /100 | #230 | Tragic 62.9% |
| Immigrants | Western Africa | 2.4 /100 | #231 | Tragic 62.8% |
| Osage | 2.2 /100 | #232 | Tragic 62.7% |
| Iroquois | 2.0 /100 | #233 | Tragic 62.6% |
| Chippewa | 2.0 /100 | #234 | Tragic 62.6% |
| Spanish Americans | 1.9 /100 | #235 | Tragic 62.6% |
| Immigrants | Immigrants | 1.7 /100 | #236 | Tragic 62.5% |
| Immigrants | Burma/Myanmar | 1.6 /100 | #237 | Tragic 62.5% |
| French American Indians | 1.5 /100 | #238 | Tragic 62.4% |
| Nepalese | 1.1 /100 | #239 | Tragic 62.2% |