Immigrants from Haiti vs Vietnamese GED/Equivalency
COMPARE
Immigrants from Haiti
Vietnamese
GED/Equivalency
GED/Equivalency Comparison
Immigrants from Haiti
Vietnamese
81.6%
GED/EQUIVALENCY
0.0/ 100
METRIC RATING
302nd/ 347
METRIC RANK
81.9%
GED/EQUIVALENCY
0.0/ 100
METRIC RATING
296th/ 347
METRIC RANK
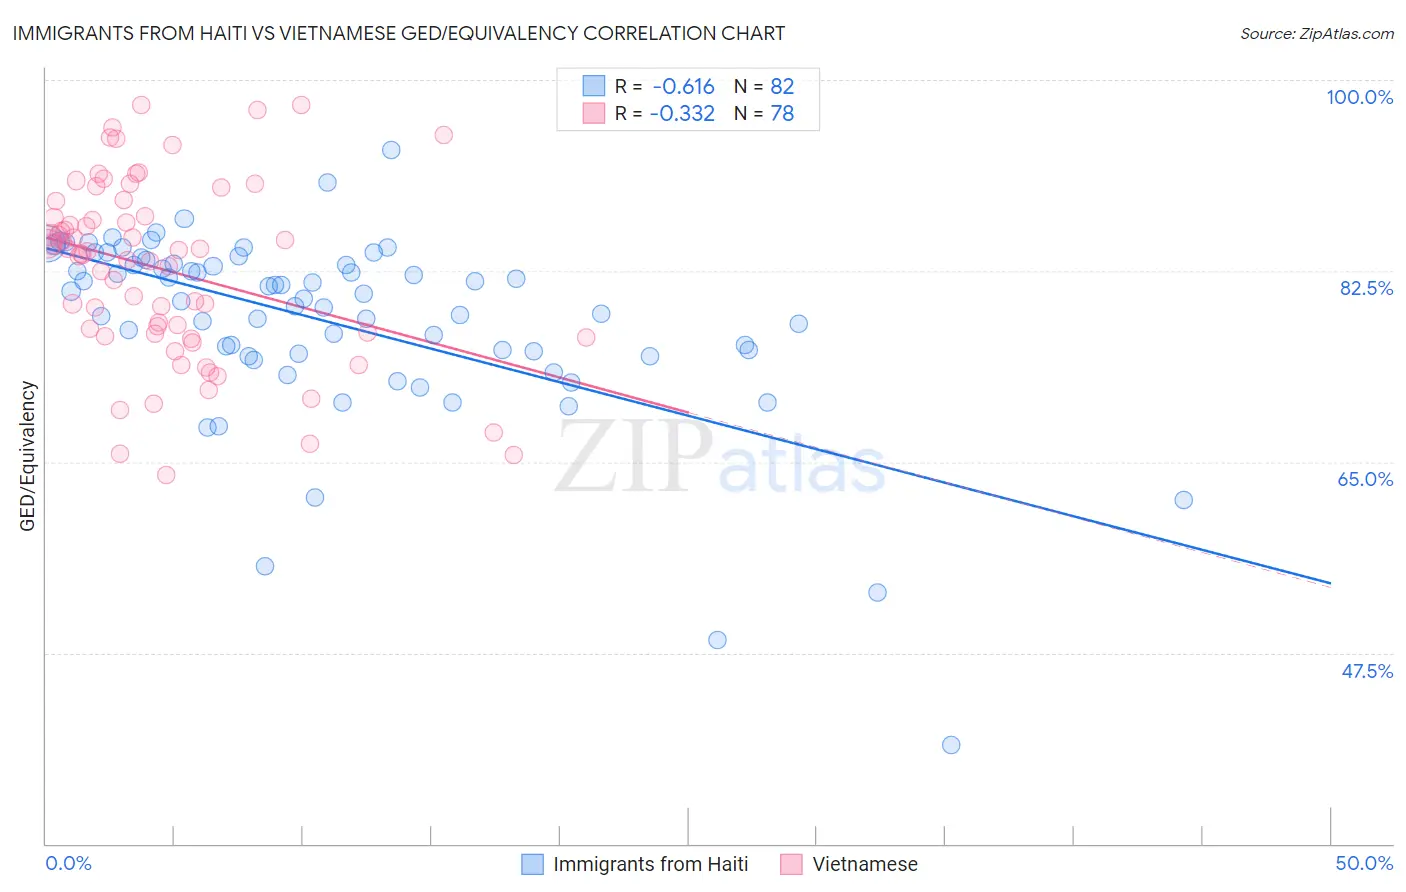
Immigrants from Haiti vs Vietnamese GED/Equivalency Correlation Chart
The statistical analysis conducted on geographies consisting of 225,286,636 people shows a significant negative correlation between the proportion of Immigrants from Haiti and percentage of population with at least ged/equivalency education in the United States with a correlation coefficient (R) of -0.616 and weighted average of 81.6%. Similarly, the statistical analysis conducted on geographies consisting of 170,753,564 people shows a mild negative correlation between the proportion of Vietnamese and percentage of population with at least ged/equivalency education in the United States with a correlation coefficient (R) of -0.332 and weighted average of 81.9%, a difference of 0.44%.
GED/Equivalency Correlation Summary
| Measurement | Immigrants from Haiti | Vietnamese |
| Minimum | 39.0% | 63.8% |
| Maximum | 93.6% | 97.7% |
| Range | 54.6% | 34.0% |
| Mean | 77.8% | 82.6% |
| Median | 80.2% | 84.2% |
| Interquartile 25% (IQ1) | 74.9% | 76.8% |
| Interquartile 75% (IQ3) | 83.1% | 87.6% |
| Interquartile Range (IQR) | 8.2% | 10.8% |
| Standard Deviation (Sample) | 8.8% | 8.2% |
| Standard Deviation (Population) | 8.8% | 8.1% |
Demographics Similar to Immigrants from Haiti and Vietnamese by GED/Equivalency
In terms of ged/equivalency, the demographic groups most similar to Immigrants from Haiti are Immigrants from Portugal (81.6%, a difference of 0.0%), Dutch West Indian (81.6%, a difference of 0.040%), Fijian (81.6%, a difference of 0.10%), Navajo (81.5%, a difference of 0.10%), and Ecuadorian (81.7%, a difference of 0.16%). Similarly, the demographic groups most similar to Vietnamese are Nepalese (81.9%, a difference of 0.030%), Immigrants from Bangladesh (81.9%, a difference of 0.040%), Immigrants from St. Vincent and the Grenadines (82.0%, a difference of 0.090%), British West Indian (82.0%, a difference of 0.11%), and Paiute (82.0%, a difference of 0.12%).
| Demographics | Rating | Rank | GED/Equivalency |
| Immigrants | Cambodia | 0.0 /100 | #289 | Tragic 82.2% |
| Haitians | 0.0 /100 | #290 | Tragic 82.1% |
| Cubans | 0.0 /100 | #291 | Tragic 82.0% |
| Paiute | 0.0 /100 | #292 | Tragic 82.0% |
| British West Indians | 0.0 /100 | #293 | Tragic 82.0% |
| Immigrants | St. Vincent and the Grenadines | 0.0 /100 | #294 | Tragic 82.0% |
| Nepalese | 0.0 /100 | #295 | Tragic 81.9% |
| Vietnamese | 0.0 /100 | #296 | Tragic 81.9% |
| Immigrants | Bangladesh | 0.0 /100 | #297 | Tragic 81.9% |
| Ute | 0.0 /100 | #298 | Tragic 81.8% |
| Ecuadorians | 0.0 /100 | #299 | Tragic 81.7% |
| Fijians | 0.0 /100 | #300 | Tragic 81.6% |
| Dutch West Indians | 0.0 /100 | #301 | Tragic 81.6% |
| Immigrants | Haiti | 0.0 /100 | #302 | Tragic 81.6% |
| Immigrants | Portugal | 0.0 /100 | #303 | Tragic 81.6% |
| Navajo | 0.0 /100 | #304 | Tragic 81.5% |
| Immigrants | Grenada | 0.0 /100 | #305 | Tragic 81.3% |
| Guyanese | 0.0 /100 | #306 | Tragic 81.3% |
| Immigrants | Dominica | 0.0 /100 | #307 | Tragic 81.1% |
| Puerto Ricans | 0.0 /100 | #308 | Tragic 81.1% |
| Immigrants | Ecuador | 0.0 /100 | #309 | Tragic 81.0% |