Immigrants from Grenada vs Tohono O'odham College, 1 year or more
COMPARE
Immigrants from Grenada
Tohono O'odham
College, 1 year or more
College, 1 year or more Comparison
Immigrants from Grenada
Tohono O'odham
54.4%
COLLEGE, 1 YEAR OR MORE
0.2/ 100
METRIC RATING
273rd/ 347
METRIC RANK
47.1%
COLLEGE, 1 YEAR OR MORE
0.0/ 100
METRIC RATING
343rd/ 347
METRIC RANK
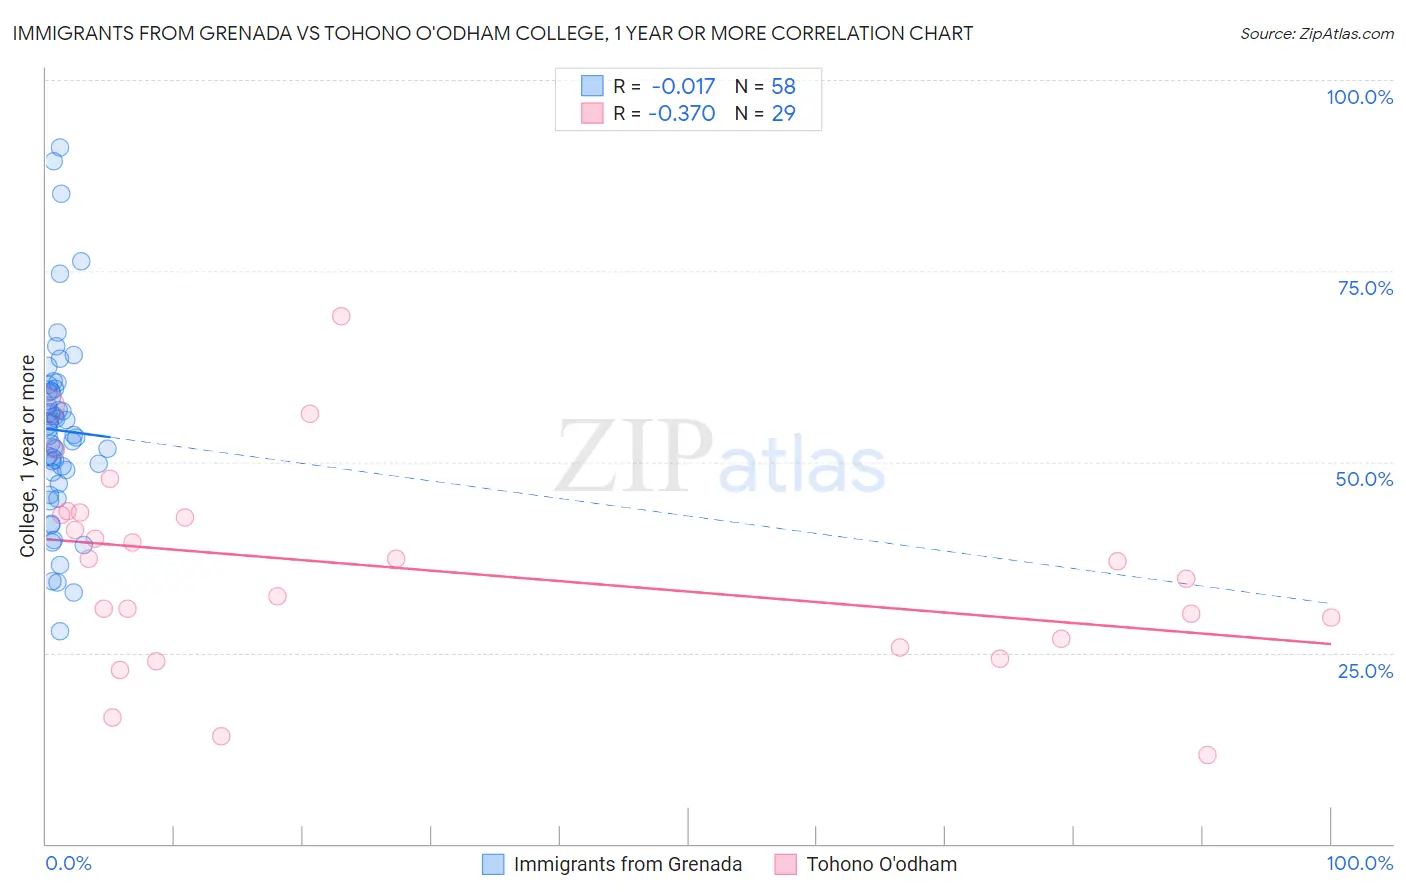
Immigrants from Grenada vs Tohono O'odham College, 1 year or more Correlation Chart
The statistical analysis conducted on geographies consisting of 67,201,096 people shows no correlation between the proportion of Immigrants from Grenada and percentage of population with at least college, 1 year or more education in the United States with a correlation coefficient (R) of -0.017 and weighted average of 54.4%. Similarly, the statistical analysis conducted on geographies consisting of 58,729,835 people shows a mild negative correlation between the proportion of Tohono O'odham and percentage of population with at least college, 1 year or more education in the United States with a correlation coefficient (R) of -0.370 and weighted average of 47.1%, a difference of 15.5%.
College, 1 year or more Correlation Summary
| Measurement | Immigrants from Grenada | Tohono O'odham |
| Minimum | 27.9% | 11.6% |
| Maximum | 91.1% | 69.1% |
| Range | 63.3% | 57.5% |
| Mean | 54.1% | 35.9% |
| Median | 53.4% | 36.9% |
| Interquartile 25% (IQ1) | 48.7% | 26.3% |
| Interquartile 75% (IQ3) | 59.3% | 43.2% |
| Interquartile Range (IQR) | 10.6% | 16.9% |
| Standard Deviation (Sample) | 12.5% | 13.2% |
| Standard Deviation (Population) | 12.4% | 12.9% |
Similar Demographics by College, 1 year or more
Demographics Similar to Immigrants from Grenada by College, 1 year or more
In terms of college, 1 year or more, the demographic groups most similar to Immigrants from Grenada are Comanche (54.4%, a difference of 0.040%), Belizean (54.4%, a difference of 0.040%), American (54.4%, a difference of 0.060%), Bahamian (54.5%, a difference of 0.080%), and Crow (54.5%, a difference of 0.11%).
| Demographics | Rating | Rank | College, 1 year or more |
| Potawatomi | 0.2 /100 | #266 | Tragic 54.6% |
| Blackfeet | 0.2 /100 | #267 | Tragic 54.6% |
| British West Indians | 0.2 /100 | #268 | Tragic 54.5% |
| Bangladeshis | 0.2 /100 | #269 | Tragic 54.5% |
| Crow | 0.2 /100 | #270 | Tragic 54.5% |
| Bahamians | 0.2 /100 | #271 | Tragic 54.5% |
| Comanche | 0.2 /100 | #272 | Tragic 54.4% |
| Immigrants | Grenada | 0.2 /100 | #273 | Tragic 54.4% |
| Belizeans | 0.2 /100 | #274 | Tragic 54.4% |
| Americans | 0.2 /100 | #275 | Tragic 54.4% |
| Shoshone | 0.2 /100 | #276 | Tragic 54.3% |
| Ecuadorians | 0.2 /100 | #277 | Tragic 54.3% |
| Immigrants | Jamaica | 0.1 /100 | #278 | Tragic 54.2% |
| Arapaho | 0.1 /100 | #279 | Tragic 54.1% |
| Cheyenne | 0.1 /100 | #280 | Tragic 54.1% |
Demographics Similar to Tohono O'odham by College, 1 year or more
In terms of college, 1 year or more, the demographic groups most similar to Tohono O'odham are Inupiat (47.2%, a difference of 0.22%), Immigrants from Mexico (47.5%, a difference of 0.79%), Yakama (46.2%, a difference of 2.0%), Immigrants from Cabo Verde (48.1%, a difference of 2.0%), and Immigrants from the Azores (48.4%, a difference of 2.6%).
| Demographics | Rating | Rank | College, 1 year or more |
| Immigrants | Dominican Republic | 0.0 /100 | #333 | Tragic 49.1% |
| Lumbee | 0.0 /100 | #334 | Tragic 48.9% |
| Yuman | 0.0 /100 | #335 | Tragic 48.7% |
| Spanish American Indians | 0.0 /100 | #336 | Tragic 48.5% |
| Pennsylvania Germans | 0.0 /100 | #337 | Tragic 48.5% |
| Immigrants | Central America | 0.0 /100 | #338 | Tragic 48.5% |
| Immigrants | Azores | 0.0 /100 | #339 | Tragic 48.4% |
| Immigrants | Cabo Verde | 0.0 /100 | #340 | Tragic 48.1% |
| Immigrants | Mexico | 0.0 /100 | #341 | Tragic 47.5% |
| Inupiat | 0.0 /100 | #342 | Tragic 47.2% |
| Tohono O'odham | 0.0 /100 | #343 | Tragic 47.1% |
| Yakama | 0.0 /100 | #344 | Tragic 46.2% |
| Pima | 0.0 /100 | #345 | Tragic 45.6% |
| Houma | 0.0 /100 | #346 | Tragic 41.2% |
| Yup'ik | 0.0 /100 | #347 | Tragic 39.4% |