Immigrants from Oceania vs Immigrants from Sudan College, 1 year or more
COMPARE
Immigrants from Oceania
Immigrants from Sudan
College, 1 year or more
College, 1 year or more Comparison
Immigrants from Oceania
Immigrants from Sudan
59.4%
COLLEGE, 1 YEAR OR MORE
51.2/ 100
METRIC RATING
173rd/ 347
METRIC RANK
60.4%
COLLEGE, 1 YEAR OR MORE
77.8/ 100
METRIC RATING
150th/ 347
METRIC RANK
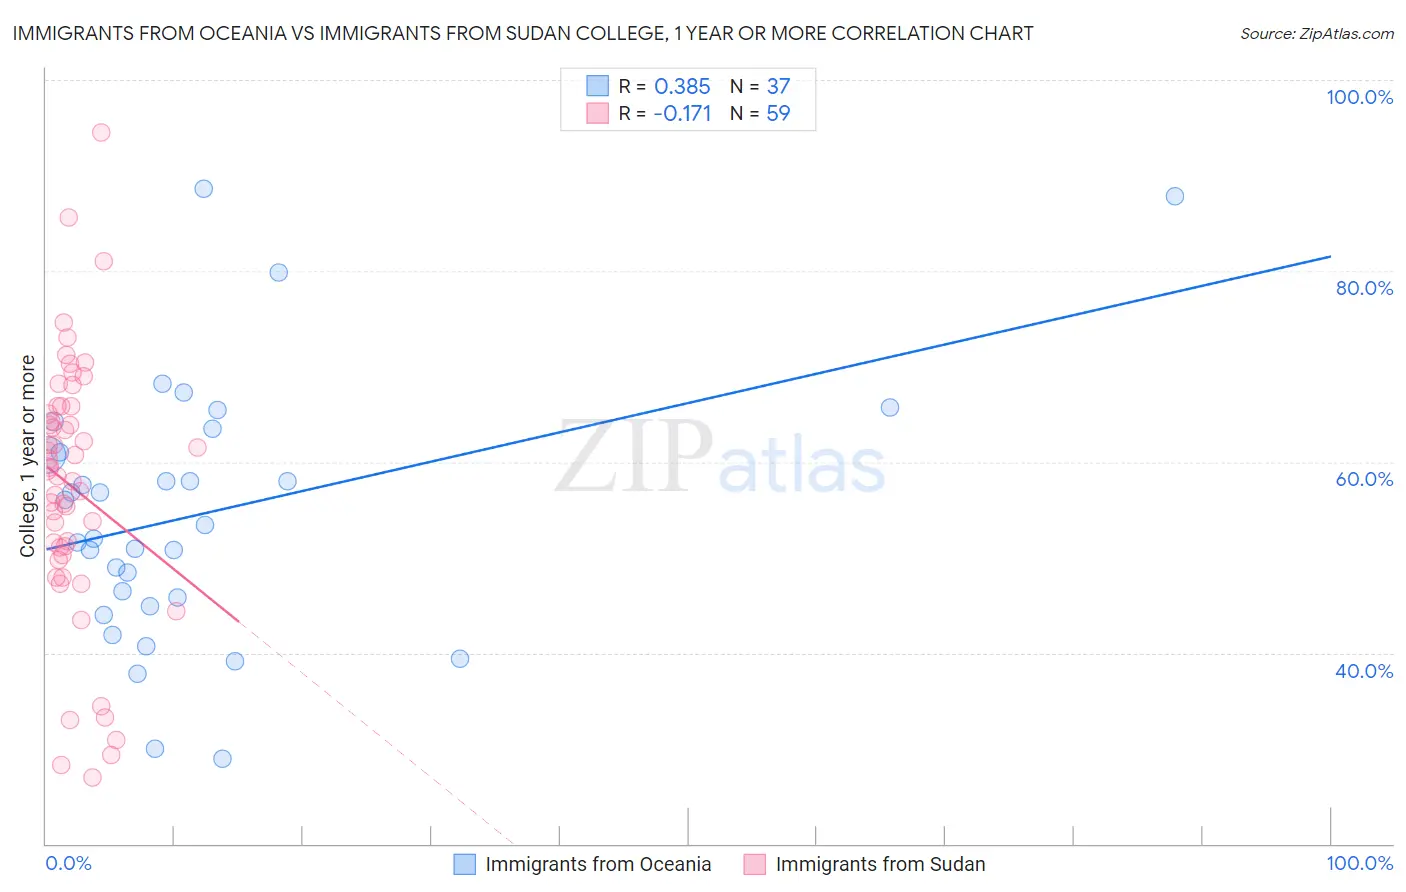
Immigrants from Oceania vs Immigrants from Sudan College, 1 year or more Correlation Chart
The statistical analysis conducted on geographies consisting of 305,519,500 people shows a mild positive correlation between the proportion of Immigrants from Oceania and percentage of population with at least college, 1 year or more education in the United States with a correlation coefficient (R) of 0.385 and weighted average of 59.4%. Similarly, the statistical analysis conducted on geographies consisting of 118,973,526 people shows a poor negative correlation between the proportion of Immigrants from Sudan and percentage of population with at least college, 1 year or more education in the United States with a correlation coefficient (R) of -0.171 and weighted average of 60.4%, a difference of 1.6%.
College, 1 year or more Correlation Summary
| Measurement | Immigrants from Oceania | Immigrants from Sudan |
| Minimum | 28.9% | 27.0% |
| Maximum | 88.6% | 94.5% |
| Range | 59.6% | 67.5% |
| Mean | 54.6% | 57.3% |
| Median | 53.4% | 59.3% |
| Interquartile 25% (IQ1) | 45.3% | 50.2% |
| Interquartile 75% (IQ3) | 62.3% | 65.8% |
| Interquartile Range (IQR) | 16.9% | 15.6% |
| Standard Deviation (Sample) | 13.6% | 13.7% |
| Standard Deviation (Population) | 13.4% | 13.6% |
Similar Demographics by College, 1 year or more
Demographics Similar to Immigrants from Oceania by College, 1 year or more
In terms of college, 1 year or more, the demographic groups most similar to Immigrants from Oceania are Immigrants from Sierra Leone (59.5%, a difference of 0.050%), Welsh (59.5%, a difference of 0.060%), Immigrants from Albania (59.5%, a difference of 0.060%), Celtic (59.4%, a difference of 0.060%), and Immigrants from Southern Europe (59.5%, a difference of 0.080%).
| Demographics | Rating | Rank | College, 1 year or more |
| Immigrants | Africa | 56.1 /100 | #166 | Average 59.6% |
| Immigrants | North Macedonia | 53.1 /100 | #167 | Average 59.5% |
| Hungarians | 52.9 /100 | #168 | Average 59.5% |
| Immigrants | Southern Europe | 52.7 /100 | #169 | Average 59.5% |
| Welsh | 52.4 /100 | #170 | Average 59.5% |
| Immigrants | Albania | 52.3 /100 | #171 | Average 59.5% |
| Immigrants | Sierra Leone | 52.2 /100 | #172 | Average 59.5% |
| Immigrants | Oceania | 51.2 /100 | #173 | Average 59.4% |
| Celtics | 50.0 /100 | #174 | Average 59.4% |
| Sri Lankans | 49.0 /100 | #175 | Average 59.4% |
| Immigrants | Poland | 48.9 /100 | #176 | Average 59.4% |
| Tlingit-Haida | 48.4 /100 | #177 | Average 59.4% |
| Czechoslovakians | 48.3 /100 | #178 | Average 59.4% |
| Bermudans | 46.6 /100 | #179 | Average 59.3% |
| Yugoslavians | 44.1 /100 | #180 | Average 59.2% |
Demographics Similar to Immigrants from Sudan by College, 1 year or more
In terms of college, 1 year or more, the demographic groups most similar to Immigrants from Sudan are Albanian (60.4%, a difference of 0.0%), Kenyan (60.5%, a difference of 0.090%), Brazilian (60.5%, a difference of 0.090%), Immigrants from Kenya (60.5%, a difference of 0.10%), and Immigrants from Germany (60.3%, a difference of 0.13%).
| Demographics | Rating | Rank | College, 1 year or more |
| Canadians | 82.7 /100 | #143 | Excellent 60.6% |
| Czechs | 81.9 /100 | #144 | Excellent 60.6% |
| Slavs | 81.1 /100 | #145 | Excellent 60.6% |
| Scottish | 80.2 /100 | #146 | Excellent 60.5% |
| Immigrants | Kenya | 79.1 /100 | #147 | Good 60.5% |
| Kenyans | 79.0 /100 | #148 | Good 60.5% |
| Brazilians | 79.0 /100 | #149 | Good 60.5% |
| Immigrants | Sudan | 77.8 /100 | #150 | Good 60.4% |
| Albanians | 77.8 /100 | #151 | Good 60.4% |
| Immigrants | Germany | 76.1 /100 | #152 | Good 60.3% |
| Sierra Leoneans | 74.1 /100 | #153 | Good 60.2% |
| Sudanese | 73.0 /100 | #154 | Good 60.2% |
| Moroccans | 72.9 /100 | #155 | Good 60.2% |
| Finns | 72.9 /100 | #156 | Good 60.2% |
| Immigrants | Armenia | 68.8 /100 | #157 | Good 60.0% |