Immigrants from Oceania vs Lithuanian Master's Degree
COMPARE
Immigrants from Oceania
Lithuanian
Master's Degree
Master's Degree Comparison
Immigrants from Oceania
Lithuanians
14.7%
MASTER'S DEGREE
37.1/ 100
METRIC RATING
186th/ 347
METRIC RANK
17.7%
MASTER'S DEGREE
99.7/ 100
METRIC RATING
72nd/ 347
METRIC RANK
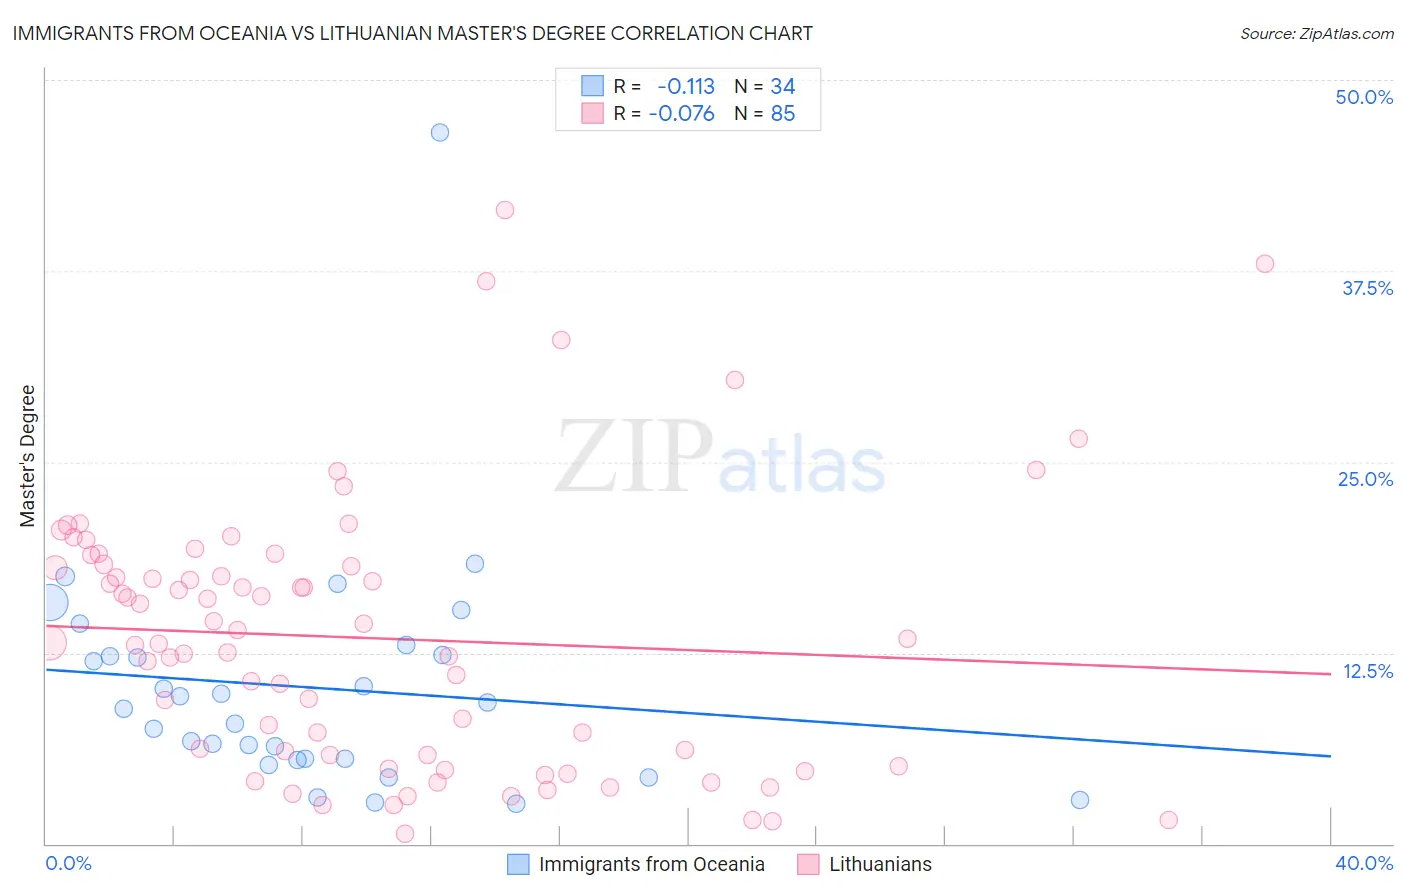
Immigrants from Oceania vs Lithuanian Master's Degree Correlation Chart
The statistical analysis conducted on geographies consisting of 305,448,765 people shows a poor negative correlation between the proportion of Immigrants from Oceania and percentage of population with at least master's degree education in the United States with a correlation coefficient (R) of -0.113 and weighted average of 14.7%. Similarly, the statistical analysis conducted on geographies consisting of 421,813,641 people shows a slight negative correlation between the proportion of Lithuanians and percentage of population with at least master's degree education in the United States with a correlation coefficient (R) of -0.076 and weighted average of 17.7%, a difference of 20.9%.
Master's Degree Correlation Summary
| Measurement | Immigrants from Oceania | Lithuanian |
| Minimum | 2.6% | 0.63% |
| Maximum | 46.6% | 41.5% |
| Range | 44.0% | 40.9% |
| Mean | 10.2% | 13.5% |
| Median | 9.0% | 13.2% |
| Interquartile 25% (IQ1) | 5.6% | 5.4% |
| Interquartile 75% (IQ3) | 12.3% | 18.2% |
| Interquartile Range (IQR) | 6.8% | 12.8% |
| Standard Deviation (Sample) | 7.9% | 8.8% |
| Standard Deviation (Population) | 7.7% | 8.7% |
Similar Demographics by Master's Degree
Demographics Similar to Immigrants from Oceania by Master's Degree
In terms of master's degree, the demographic groups most similar to Immigrants from Oceania are Basque (14.7%, a difference of 0.080%), Immigrants from Costa Rica (14.7%, a difference of 0.12%), Barbadian (14.7%, a difference of 0.16%), Immigrants (14.6%, a difference of 0.16%), and Spaniard (14.6%, a difference of 0.19%).
| Demographics | Rating | Rank | Master's Degree |
| Immigrants | Iraq | 41.3 /100 | #179 | Average 14.8% |
| Celtics | 41.3 /100 | #180 | Average 14.8% |
| Swiss | 41.1 /100 | #181 | Average 14.7% |
| Czechs | 40.4 /100 | #182 | Average 14.7% |
| Sri Lankans | 39.6 /100 | #183 | Fair 14.7% |
| Immigrants | Zaire | 39.5 /100 | #184 | Fair 14.7% |
| Barbadians | 38.3 /100 | #185 | Fair 14.7% |
| Immigrants | Oceania | 37.1 /100 | #186 | Fair 14.7% |
| Basques | 36.5 /100 | #187 | Fair 14.7% |
| Immigrants | Costa Rica | 36.2 /100 | #188 | Fair 14.7% |
| Immigrants | Immigrants | 36.0 /100 | #189 | Fair 14.6% |
| Spaniards | 35.8 /100 | #190 | Fair 14.6% |
| Welsh | 34.2 /100 | #191 | Fair 14.6% |
| Immigrants | Middle Africa | 33.6 /100 | #192 | Fair 14.6% |
| Immigrants | Nigeria | 32.7 /100 | #193 | Fair 14.6% |
Demographics Similar to Lithuanians by Master's Degree
In terms of master's degree, the demographic groups most similar to Lithuanians are Zimbabwean (17.7%, a difference of 0.11%), Immigrants from Pakistan (17.8%, a difference of 0.17%), Immigrants from Romania (17.7%, a difference of 0.41%), Immigrants from Western Europe (17.8%, a difference of 0.46%), and Immigrants from Uzbekistan (17.9%, a difference of 0.67%).
| Demographics | Rating | Rank | Master's Degree |
| Immigrants | Kazakhstan | 99.8 /100 | #65 | Exceptional 18.0% |
| Ethiopians | 99.8 /100 | #66 | Exceptional 18.0% |
| Immigrants | Argentina | 99.8 /100 | #67 | Exceptional 18.0% |
| Immigrants | Ethiopia | 99.8 /100 | #68 | Exceptional 17.9% |
| Immigrants | Uzbekistan | 99.8 /100 | #69 | Exceptional 17.9% |
| Immigrants | Western Europe | 99.8 /100 | #70 | Exceptional 17.8% |
| Immigrants | Pakistan | 99.7 /100 | #71 | Exceptional 17.8% |
| Lithuanians | 99.7 /100 | #72 | Exceptional 17.7% |
| Zimbabweans | 99.7 /100 | #73 | Exceptional 17.7% |
| Immigrants | Romania | 99.7 /100 | #74 | Exceptional 17.7% |
| Egyptians | 99.6 /100 | #75 | Exceptional 17.6% |
| Immigrants | Indonesia | 99.6 /100 | #76 | Exceptional 17.6% |
| Immigrants | Eastern Europe | 99.6 /100 | #77 | Exceptional 17.6% |
| Immigrants | Hungary | 99.6 /100 | #78 | Exceptional 17.5% |
| Immigrants | Lebanon | 99.6 /100 | #79 | Exceptional 17.5% |