Immigrants from Oceania vs Brazilian Master's Degree
COMPARE
Immigrants from Oceania
Brazilian
Master's Degree
Master's Degree Comparison
Immigrants from Oceania
Brazilians
14.7%
MASTER'S DEGREE
37.1/ 100
METRIC RATING
186th/ 347
METRIC RANK
16.5%
MASTER'S DEGREE
96.8/ 100
METRIC RATING
118th/ 347
METRIC RANK
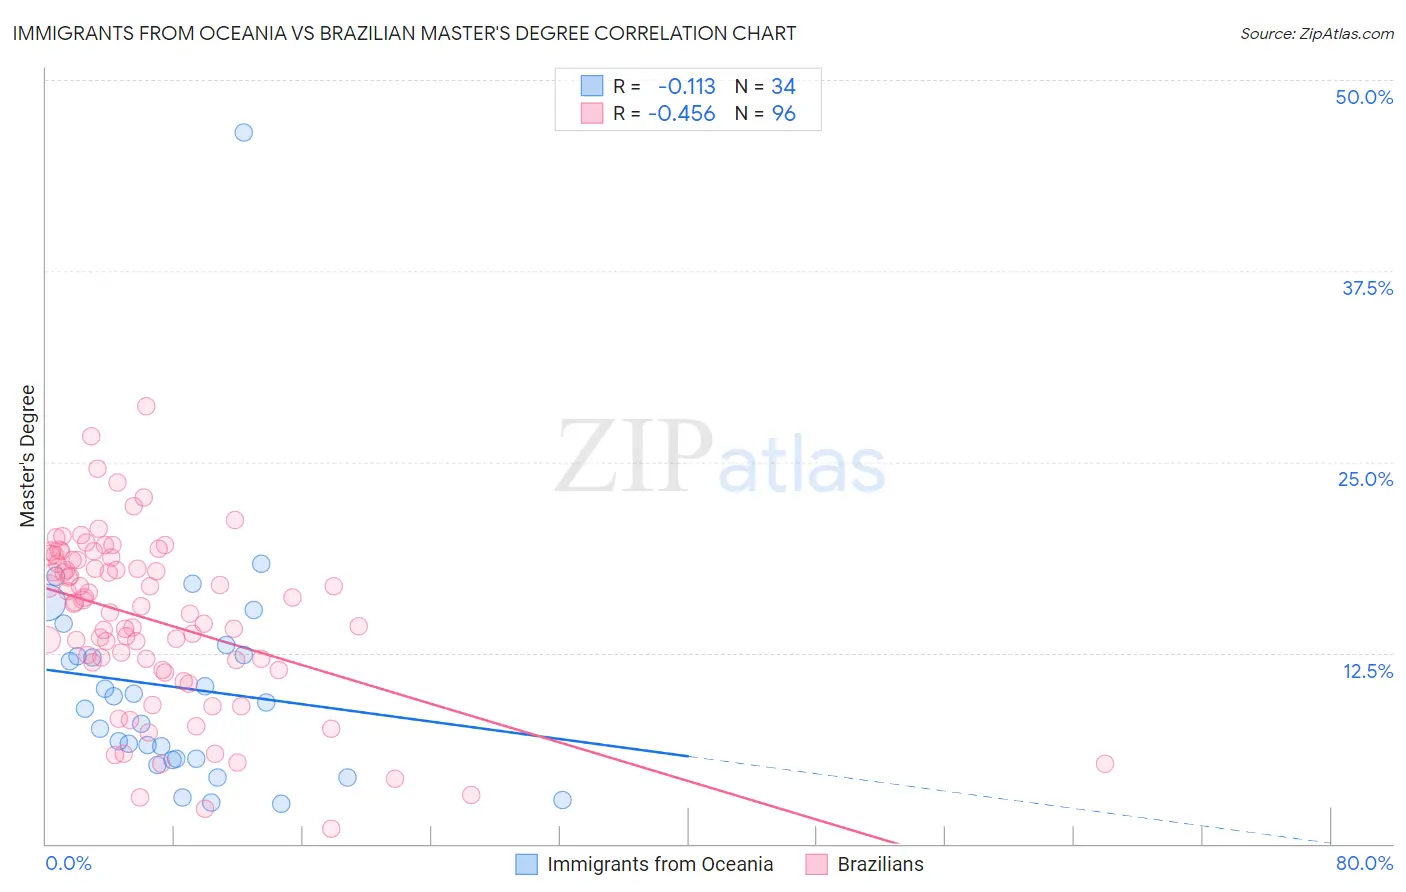
Immigrants from Oceania vs Brazilian Master's Degree Correlation Chart
The statistical analysis conducted on geographies consisting of 305,448,765 people shows a poor negative correlation between the proportion of Immigrants from Oceania and percentage of population with at least master's degree education in the United States with a correlation coefficient (R) of -0.113 and weighted average of 14.7%. Similarly, the statistical analysis conducted on geographies consisting of 323,872,628 people shows a moderate negative correlation between the proportion of Brazilians and percentage of population with at least master's degree education in the United States with a correlation coefficient (R) of -0.456 and weighted average of 16.5%, a difference of 12.8%.
Master's Degree Correlation Summary
| Measurement | Immigrants from Oceania | Brazilian |
| Minimum | 2.6% | 0.97% |
| Maximum | 46.6% | 28.6% |
| Range | 44.0% | 27.6% |
| Mean | 10.2% | 14.6% |
| Median | 9.0% | 15.7% |
| Interquartile 25% (IQ1) | 5.6% | 11.6% |
| Interquartile 75% (IQ3) | 12.3% | 18.6% |
| Interquartile Range (IQR) | 6.8% | 7.0% |
| Standard Deviation (Sample) | 7.9% | 5.5% |
| Standard Deviation (Population) | 7.7% | 5.5% |
Similar Demographics by Master's Degree
Demographics Similar to Immigrants from Oceania by Master's Degree
In terms of master's degree, the demographic groups most similar to Immigrants from Oceania are Basque (14.7%, a difference of 0.080%), Immigrants from Costa Rica (14.7%, a difference of 0.12%), Barbadian (14.7%, a difference of 0.16%), Immigrants (14.6%, a difference of 0.16%), and Spaniard (14.6%, a difference of 0.19%).
| Demographics | Rating | Rank | Master's Degree |
| Immigrants | Iraq | 41.3 /100 | #179 | Average 14.8% |
| Celtics | 41.3 /100 | #180 | Average 14.8% |
| Swiss | 41.1 /100 | #181 | Average 14.7% |
| Czechs | 40.4 /100 | #182 | Average 14.7% |
| Sri Lankans | 39.6 /100 | #183 | Fair 14.7% |
| Immigrants | Zaire | 39.5 /100 | #184 | Fair 14.7% |
| Barbadians | 38.3 /100 | #185 | Fair 14.7% |
| Immigrants | Oceania | 37.1 /100 | #186 | Fair 14.7% |
| Basques | 36.5 /100 | #187 | Fair 14.7% |
| Immigrants | Costa Rica | 36.2 /100 | #188 | Fair 14.7% |
| Immigrants | Immigrants | 36.0 /100 | #189 | Fair 14.6% |
| Spaniards | 35.8 /100 | #190 | Fair 14.6% |
| Welsh | 34.2 /100 | #191 | Fair 14.6% |
| Immigrants | Middle Africa | 33.6 /100 | #192 | Fair 14.6% |
| Immigrants | Nigeria | 32.7 /100 | #193 | Fair 14.6% |
Demographics Similar to Brazilians by Master's Degree
In terms of master's degree, the demographic groups most similar to Brazilians are Jordanian (16.5%, a difference of 0.23%), Lebanese (16.5%, a difference of 0.33%), Immigrants from Moldova (16.6%, a difference of 0.42%), Immigrants from Southern Europe (16.6%, a difference of 0.43%), and Afghan (16.5%, a difference of 0.53%).
| Demographics | Rating | Rank | Master's Degree |
| Austrians | 97.8 /100 | #111 | Exceptional 16.7% |
| Macedonians | 97.7 /100 | #112 | Exceptional 16.7% |
| Arabs | 97.7 /100 | #113 | Exceptional 16.7% |
| Northern Europeans | 97.6 /100 | #114 | Exceptional 16.7% |
| Immigrants | Uganda | 97.3 /100 | #115 | Exceptional 16.6% |
| Immigrants | Southern Europe | 97.2 /100 | #116 | Exceptional 16.6% |
| Immigrants | Moldova | 97.2 /100 | #117 | Exceptional 16.6% |
| Brazilians | 96.8 /100 | #118 | Exceptional 16.5% |
| Jordanians | 96.5 /100 | #119 | Exceptional 16.5% |
| Lebanese | 96.4 /100 | #120 | Exceptional 16.5% |
| Afghans | 96.2 /100 | #121 | Exceptional 16.5% |
| British | 95.6 /100 | #122 | Exceptional 16.4% |
| Croatians | 95.6 /100 | #123 | Exceptional 16.4% |
| Immigrants | Eritrea | 95.5 /100 | #124 | Exceptional 16.4% |
| Italians | 95.4 /100 | #125 | Exceptional 16.4% |