Immigrants from Oceania vs Immigrants from Italy Master's Degree
COMPARE
Immigrants from Oceania
Immigrants from Italy
Master's Degree
Master's Degree Comparison
Immigrants from Oceania
Immigrants from Italy
14.7%
MASTER'S DEGREE
37.1/ 100
METRIC RATING
186th/ 347
METRIC RANK
17.2%
MASTER'S DEGREE
99.1/ 100
METRIC RATING
93rd/ 347
METRIC RANK
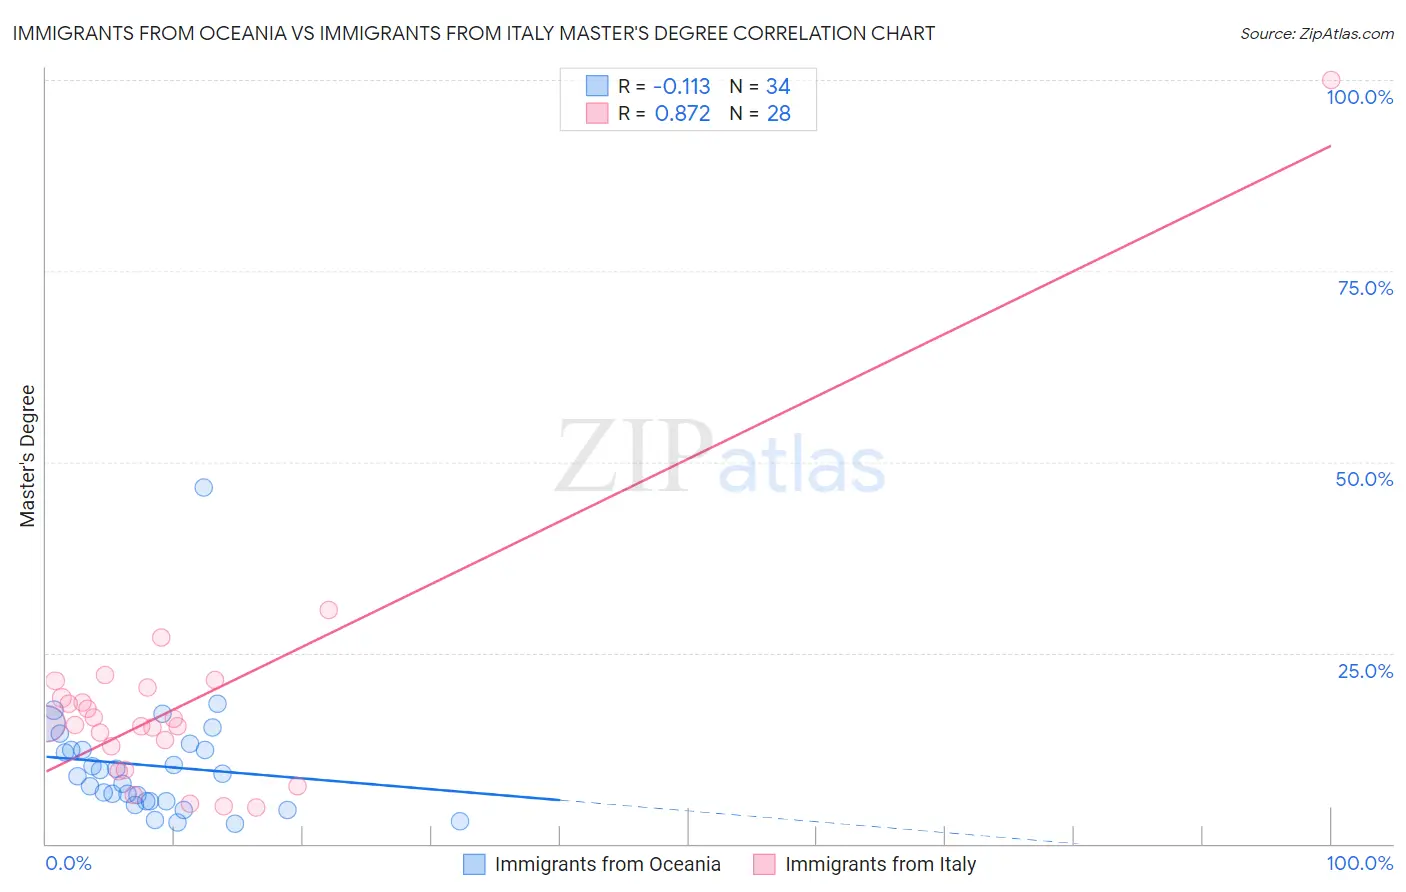
Immigrants from Oceania vs Immigrants from Italy Master's Degree Correlation Chart
The statistical analysis conducted on geographies consisting of 305,448,765 people shows a poor negative correlation between the proportion of Immigrants from Oceania and percentage of population with at least master's degree education in the United States with a correlation coefficient (R) of -0.113 and weighted average of 14.7%. Similarly, the statistical analysis conducted on geographies consisting of 324,197,750 people shows a very strong positive correlation between the proportion of Immigrants from Italy and percentage of population with at least master's degree education in the United States with a correlation coefficient (R) of 0.872 and weighted average of 17.2%, a difference of 17.0%.
Master's Degree Correlation Summary
| Measurement | Immigrants from Oceania | Immigrants from Italy |
| Minimum | 2.6% | 4.8% |
| Maximum | 46.6% | 100.0% |
| Range | 44.0% | 95.2% |
| Mean | 10.2% | 18.4% |
| Median | 9.0% | 15.6% |
| Interquartile 25% (IQ1) | 5.6% | 11.2% |
| Interquartile 75% (IQ3) | 12.3% | 19.7% |
| Interquartile Range (IQR) | 6.8% | 8.5% |
| Standard Deviation (Sample) | 7.9% | 17.2% |
| Standard Deviation (Population) | 7.7% | 16.9% |
Similar Demographics by Master's Degree
Demographics Similar to Immigrants from Oceania by Master's Degree
In terms of master's degree, the demographic groups most similar to Immigrants from Oceania are Basque (14.7%, a difference of 0.080%), Immigrants from Costa Rica (14.7%, a difference of 0.12%), Barbadian (14.7%, a difference of 0.16%), Immigrants (14.6%, a difference of 0.16%), and Spaniard (14.6%, a difference of 0.19%).
| Demographics | Rating | Rank | Master's Degree |
| Immigrants | Iraq | 41.3 /100 | #179 | Average 14.8% |
| Celtics | 41.3 /100 | #180 | Average 14.8% |
| Swiss | 41.1 /100 | #181 | Average 14.7% |
| Czechs | 40.4 /100 | #182 | Average 14.7% |
| Sri Lankans | 39.6 /100 | #183 | Fair 14.7% |
| Immigrants | Zaire | 39.5 /100 | #184 | Fair 14.7% |
| Barbadians | 38.3 /100 | #185 | Fair 14.7% |
| Immigrants | Oceania | 37.1 /100 | #186 | Fair 14.7% |
| Basques | 36.5 /100 | #187 | Fair 14.7% |
| Immigrants | Costa Rica | 36.2 /100 | #188 | Fair 14.7% |
| Immigrants | Immigrants | 36.0 /100 | #189 | Fair 14.6% |
| Spaniards | 35.8 /100 | #190 | Fair 14.6% |
| Welsh | 34.2 /100 | #191 | Fair 14.6% |
| Immigrants | Middle Africa | 33.6 /100 | #192 | Fair 14.6% |
| Immigrants | Nigeria | 32.7 /100 | #193 | Fair 14.6% |
Demographics Similar to Immigrants from Italy by Master's Degree
In terms of master's degree, the demographic groups most similar to Immigrants from Italy are Immigrants from North America (17.2%, a difference of 0.060%), Romanian (17.2%, a difference of 0.11%), Ugandan (17.1%, a difference of 0.13%), Immigrants from Egypt (17.2%, a difference of 0.18%), and Bhutanese (17.2%, a difference of 0.20%).
| Demographics | Rating | Rank | Master's Degree |
| Immigrants | Croatia | 99.3 /100 | #86 | Exceptional 17.3% |
| Maltese | 99.3 /100 | #87 | Exceptional 17.3% |
| Immigrants | Canada | 99.2 /100 | #88 | Exceptional 17.2% |
| Bhutanese | 99.1 /100 | #89 | Exceptional 17.2% |
| Immigrants | Egypt | 99.1 /100 | #90 | Exceptional 17.2% |
| Romanians | 99.1 /100 | #91 | Exceptional 17.2% |
| Immigrants | North America | 99.1 /100 | #92 | Exceptional 17.2% |
| Immigrants | Italy | 99.1 /100 | #93 | Exceptional 17.2% |
| Ugandans | 99.0 /100 | #94 | Exceptional 17.1% |
| Immigrants | Morocco | 98.9 /100 | #95 | Exceptional 17.1% |
| Immigrants | Northern Africa | 98.9 /100 | #96 | Exceptional 17.1% |
| Immigrants | England | 98.8 /100 | #97 | Exceptional 17.0% |
| Immigrants | Ukraine | 98.8 /100 | #98 | Exceptional 17.0% |
| Laotians | 98.8 /100 | #99 | Exceptional 17.0% |
| Albanians | 98.7 /100 | #100 | Exceptional 17.0% |