Immigrants from Nepal vs Bolivian High School Diploma
COMPARE
Immigrants from Nepal
Bolivian
High School Diploma
High School Diploma Comparison
Immigrants from Nepal
Bolivians
89.3%
HIGH SCHOOL DIPLOMA
61.1/ 100
METRIC RATING
164th/ 347
METRIC RANK
89.1%
HIGH SCHOOL DIPLOMA
45.2/ 100
METRIC RATING
180th/ 347
METRIC RANK
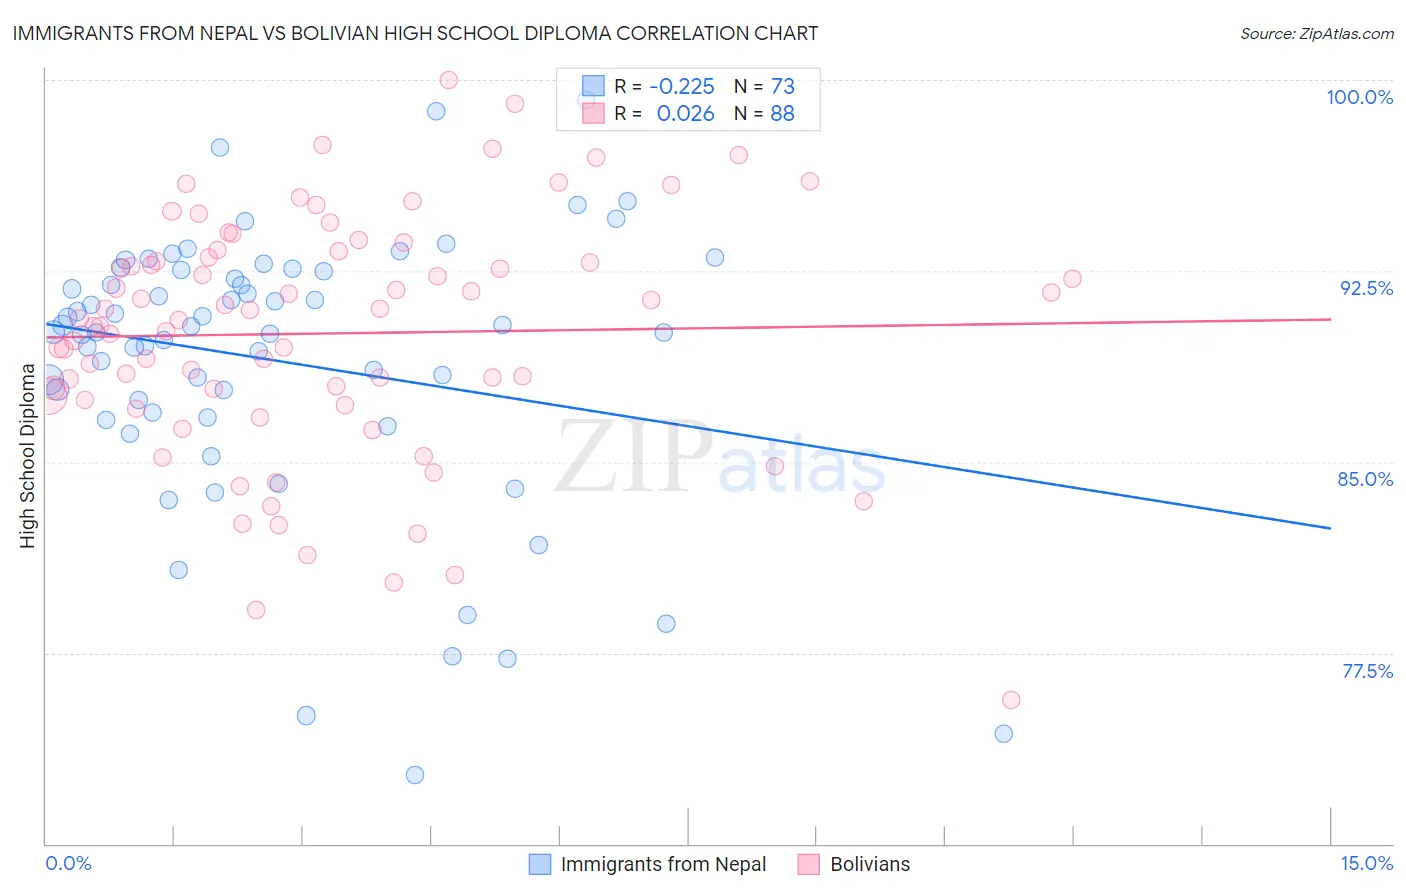
Immigrants from Nepal vs Bolivian High School Diploma Correlation Chart
The statistical analysis conducted on geographies consisting of 186,780,807 people shows a weak negative correlation between the proportion of Immigrants from Nepal and percentage of population with at least high school diploma education in the United States with a correlation coefficient (R) of -0.225 and weighted average of 89.3%. Similarly, the statistical analysis conducted on geographies consisting of 184,667,452 people shows no correlation between the proportion of Bolivians and percentage of population with at least high school diploma education in the United States with a correlation coefficient (R) of 0.026 and weighted average of 89.1%, a difference of 0.24%.
High School Diploma Correlation Summary
| Measurement | Immigrants from Nepal | Bolivian |
| Minimum | 72.7% | 75.6% |
| Maximum | 99.2% | 100.0% |
| Range | 26.5% | 24.4% |
| Mean | 89.0% | 90.0% |
| Median | 90.1% | 90.6% |
| Interquartile 25% (IQ1) | 86.9% | 87.5% |
| Interquartile 75% (IQ3) | 92.5% | 93.2% |
| Interquartile Range (IQR) | 5.6% | 5.6% |
| Standard Deviation (Sample) | 5.4% | 4.8% |
| Standard Deviation (Population) | 5.4% | 4.7% |
Demographics Similar to Immigrants from Nepal and Bolivians by High School Diploma
In terms of high school diploma, the demographic groups most similar to Immigrants from Nepal are Bermudan (89.3%, a difference of 0.0%), Cree (89.3%, a difference of 0.0%), Immigrants from Asia (89.3%, a difference of 0.020%), Immigrants from Albania (89.3%, a difference of 0.030%), and Immigrants from Hong Kong (89.3%, a difference of 0.040%). Similarly, the demographic groups most similar to Bolivians are Venezuelan (89.1%, a difference of 0.020%), American (89.1%, a difference of 0.030%), Spaniard (89.1%, a difference of 0.030%), Sudanese (89.1%, a difference of 0.050%), and Sierra Leonean (89.1%, a difference of 0.050%).
| Demographics | Rating | Rank | High School Diploma |
| Bermudans | 61.1 /100 | #162 | Good 89.3% |
| Cree | 61.1 /100 | #163 | Good 89.3% |
| Immigrants | Nepal | 61.1 /100 | #164 | Good 89.3% |
| Immigrants | Asia | 59.8 /100 | #165 | Average 89.3% |
| Immigrants | Albania | 59.4 /100 | #166 | Average 89.3% |
| Immigrants | Hong Kong | 58.6 /100 | #167 | Average 89.3% |
| Delaware | 55.8 /100 | #168 | Average 89.2% |
| Iroquois | 55.1 /100 | #169 | Average 89.2% |
| Immigrants | Morocco | 53.3 /100 | #170 | Average 89.2% |
| Spanish | 52.9 /100 | #171 | Average 89.2% |
| Immigrants | Nonimmigrants | 51.8 /100 | #172 | Average 89.2% |
| Immigrants | Indonesia | 50.3 /100 | #173 | Average 89.1% |
| Hmong | 50.0 /100 | #174 | Average 89.1% |
| Immigrants | Western Asia | 49.0 /100 | #175 | Average 89.1% |
| Osage | 48.9 /100 | #176 | Average 89.1% |
| Sudanese | 48.5 /100 | #177 | Average 89.1% |
| Sierra Leoneans | 48.4 /100 | #178 | Average 89.1% |
| Americans | 47.2 /100 | #179 | Average 89.1% |
| Bolivians | 45.2 /100 | #180 | Average 89.1% |
| Venezuelans | 43.6 /100 | #181 | Average 89.1% |
| Spaniards | 43.4 /100 | #182 | Average 89.1% |