Filipino vs Bolivian High School Diploma
COMPARE
Filipino
Bolivian
High School Diploma
High School Diploma Comparison
Filipinos
Bolivians
91.6%
HIGH SCHOOL DIPLOMA
99.9/ 100
METRIC RATING
21st/ 347
METRIC RANK
89.1%
HIGH SCHOOL DIPLOMA
45.2/ 100
METRIC RATING
180th/ 347
METRIC RANK
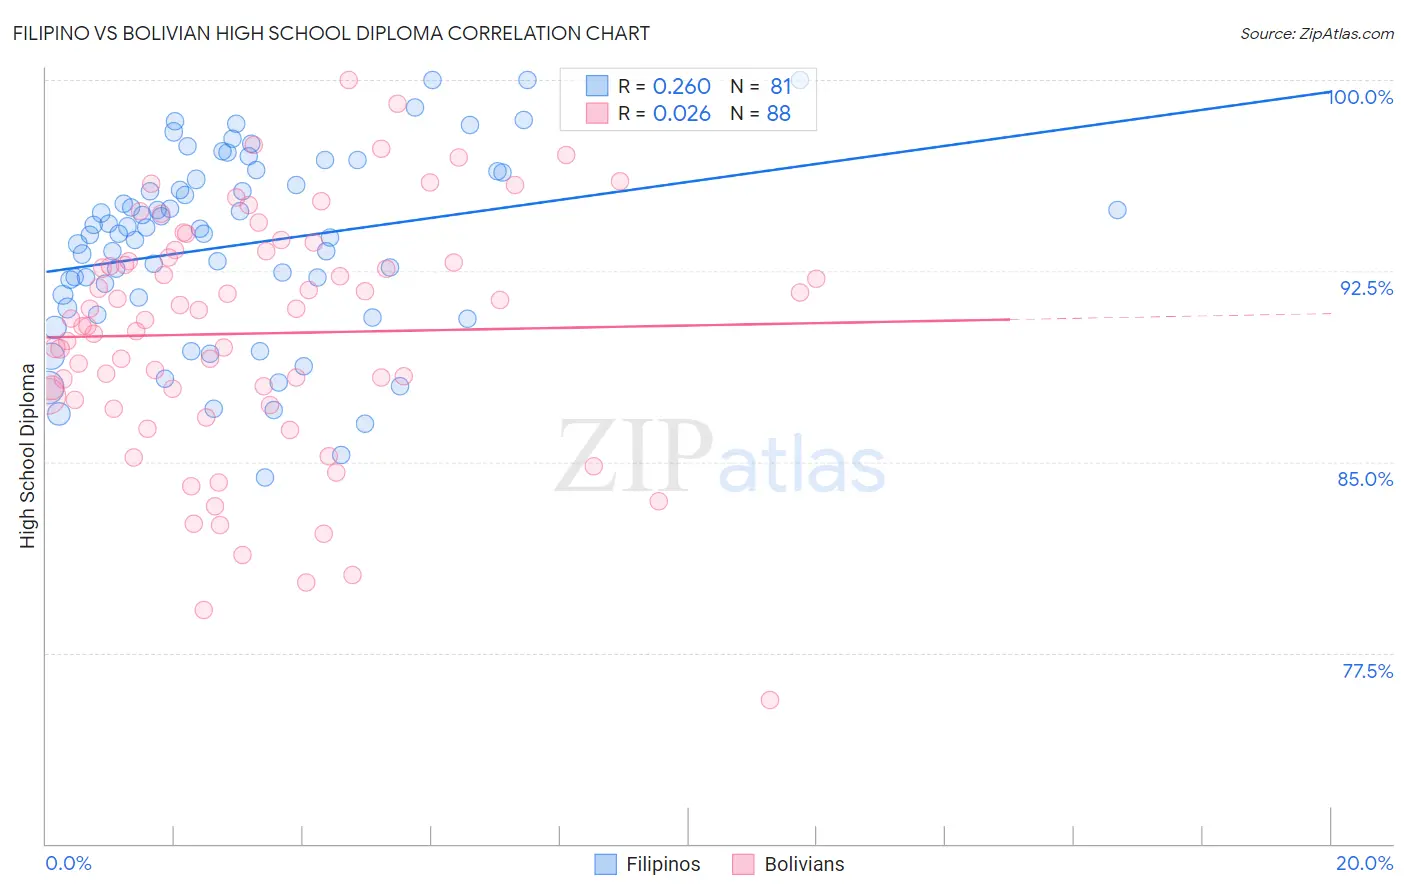
Filipino vs Bolivian High School Diploma Correlation Chart
The statistical analysis conducted on geographies consisting of 254,351,912 people shows a weak positive correlation between the proportion of Filipinos and percentage of population with at least high school diploma education in the United States with a correlation coefficient (R) of 0.260 and weighted average of 91.6%. Similarly, the statistical analysis conducted on geographies consisting of 184,667,452 people shows no correlation between the proportion of Bolivians and percentage of population with at least high school diploma education in the United States with a correlation coefficient (R) of 0.026 and weighted average of 89.1%, a difference of 2.8%.
High School Diploma Correlation Summary
| Measurement | Filipino | Bolivian |
| Minimum | 84.4% | 75.6% |
| Maximum | 100.0% | 100.0% |
| Range | 15.6% | 24.4% |
| Mean | 93.5% | 90.0% |
| Median | 94.0% | 90.6% |
| Interquartile 25% (IQ1) | 91.2% | 87.5% |
| Interquartile 75% (IQ3) | 96.2% | 93.2% |
| Interquartile Range (IQR) | 5.0% | 5.6% |
| Standard Deviation (Sample) | 3.6% | 4.8% |
| Standard Deviation (Population) | 3.6% | 4.7% |
Similar Demographics by High School Diploma
Demographics Similar to Filipinos by High School Diploma
In terms of high school diploma, the demographic groups most similar to Filipinos are Czech (91.6%, a difference of 0.010%), Estonian (91.6%, a difference of 0.010%), Maltese (91.6%, a difference of 0.040%), Scandinavian (91.5%, a difference of 0.040%), and Italian (91.5%, a difference of 0.040%).
| Demographics | Rating | Rank | High School Diploma |
| Bulgarians | 100.0 /100 | #14 | Exceptional 91.8% |
| Luxembourgers | 100.0 /100 | #15 | Exceptional 91.7% |
| Finns | 100.0 /100 | #16 | Exceptional 91.7% |
| Immigrants | Singapore | 99.9 /100 | #17 | Exceptional 91.7% |
| Germans | 99.9 /100 | #18 | Exceptional 91.7% |
| Maltese | 99.9 /100 | #19 | Exceptional 91.6% |
| Czechs | 99.9 /100 | #20 | Exceptional 91.6% |
| Filipinos | 99.9 /100 | #21 | Exceptional 91.6% |
| Estonians | 99.9 /100 | #22 | Exceptional 91.6% |
| Scandinavians | 99.9 /100 | #23 | Exceptional 91.5% |
| Italians | 99.9 /100 | #24 | Exceptional 91.5% |
| Thais | 99.9 /100 | #25 | Exceptional 91.5% |
| Russians | 99.9 /100 | #26 | Exceptional 91.5% |
| Cypriots | 99.9 /100 | #27 | Exceptional 91.5% |
| Tlingit-Haida | 99.9 /100 | #28 | Exceptional 91.4% |
Demographics Similar to Bolivians by High School Diploma
In terms of high school diploma, the demographic groups most similar to Bolivians are Venezuelan (89.1%, a difference of 0.020%), American (89.1%, a difference of 0.030%), Spaniard (89.1%, a difference of 0.030%), Potawatomi (89.0%, a difference of 0.040%), and Sudanese (89.1%, a difference of 0.050%).
| Demographics | Rating | Rank | High School Diploma |
| Immigrants | Indonesia | 50.3 /100 | #173 | Average 89.1% |
| Hmong | 50.0 /100 | #174 | Average 89.1% |
| Immigrants | Western Asia | 49.0 /100 | #175 | Average 89.1% |
| Osage | 48.9 /100 | #176 | Average 89.1% |
| Sudanese | 48.5 /100 | #177 | Average 89.1% |
| Sierra Leoneans | 48.4 /100 | #178 | Average 89.1% |
| Americans | 47.2 /100 | #179 | Average 89.1% |
| Bolivians | 45.2 /100 | #180 | Average 89.1% |
| Venezuelans | 43.6 /100 | #181 | Average 89.1% |
| Spaniards | 43.4 /100 | #182 | Average 89.1% |
| Potawatomi | 42.5 /100 | #183 | Average 89.0% |
| Immigrants | Syria | 39.2 /100 | #184 | Fair 89.0% |
| Ethiopians | 37.0 /100 | #185 | Fair 89.0% |
| Immigrants | Eastern Africa | 35.8 /100 | #186 | Fair 88.9% |
| Guamanians/Chamorros | 35.5 /100 | #187 | Fair 88.9% |