Spanish vs Bolivian High School Diploma
COMPARE
Spanish
Bolivian
High School Diploma
High School Diploma Comparison
Spanish
Bolivians
89.2%
HIGH SCHOOL DIPLOMA
52.9/ 100
METRIC RATING
171st/ 347
METRIC RANK
89.1%
HIGH SCHOOL DIPLOMA
45.2/ 100
METRIC RATING
180th/ 347
METRIC RANK
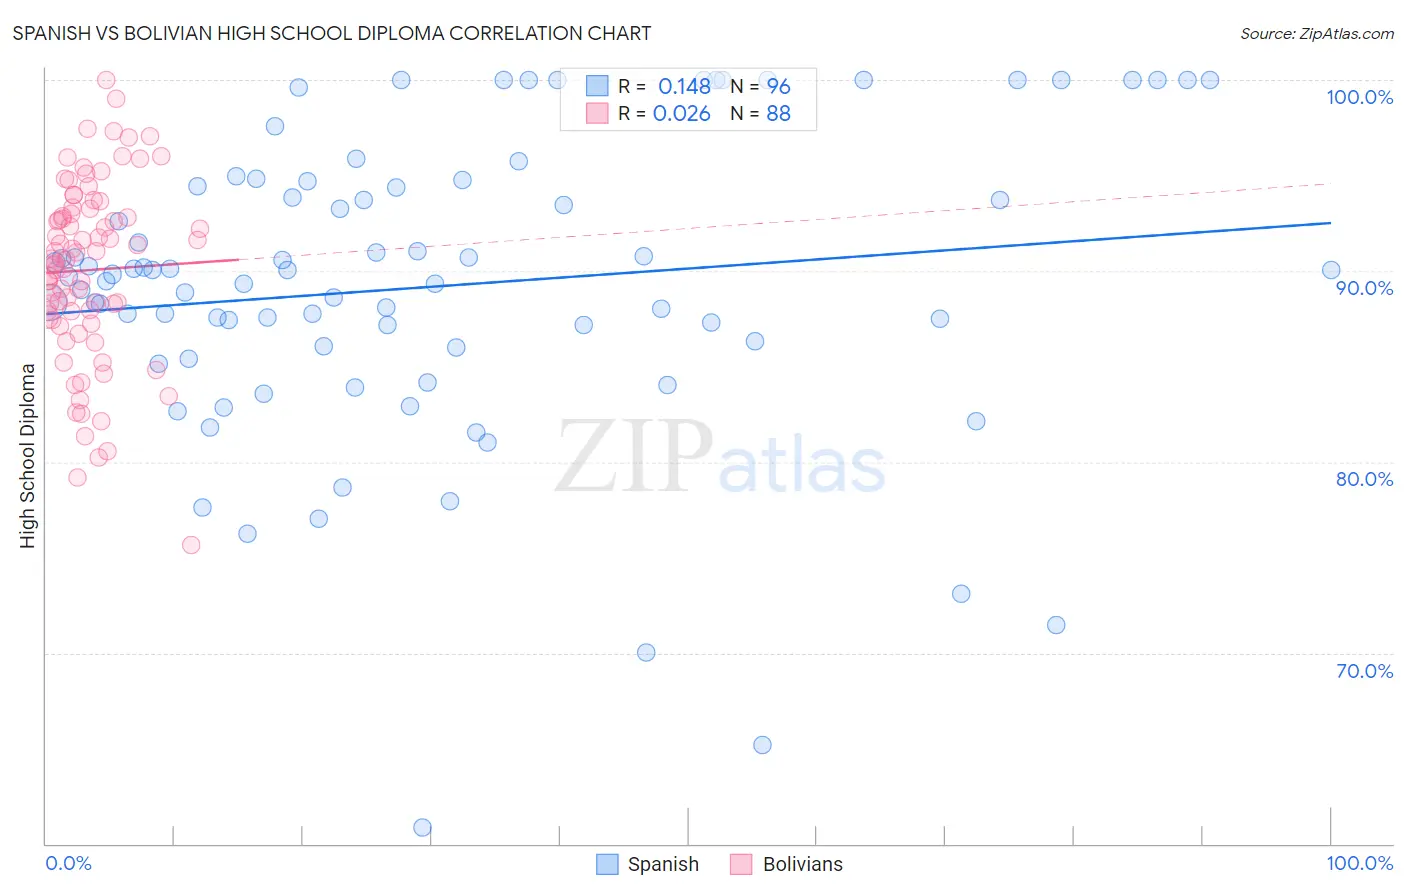
Spanish vs Bolivian High School Diploma Correlation Chart
The statistical analysis conducted on geographies consisting of 422,189,152 people shows a poor positive correlation between the proportion of Spanish and percentage of population with at least high school diploma education in the United States with a correlation coefficient (R) of 0.148 and weighted average of 89.2%. Similarly, the statistical analysis conducted on geographies consisting of 184,667,452 people shows no correlation between the proportion of Bolivians and percentage of population with at least high school diploma education in the United States with a correlation coefficient (R) of 0.026 and weighted average of 89.1%, a difference of 0.12%.
High School Diploma Correlation Summary
| Measurement | Spanish | Bolivian |
| Minimum | 60.9% | 75.6% |
| Maximum | 100.0% | 100.0% |
| Range | 39.1% | 24.4% |
| Mean | 89.2% | 90.0% |
| Median | 89.8% | 90.6% |
| Interquartile 25% (IQ1) | 86.0% | 87.5% |
| Interquartile 75% (IQ3) | 94.4% | 93.2% |
| Interquartile Range (IQR) | 8.4% | 5.6% |
| Standard Deviation (Sample) | 7.9% | 4.8% |
| Standard Deviation (Population) | 7.8% | 4.7% |
Demographics Similar to Spanish and Bolivians by High School Diploma
In terms of high school diploma, the demographic groups most similar to Spanish are Immigrants from Morocco (89.2%, a difference of 0.010%), Nonimmigrants (89.2%, a difference of 0.020%), Iroquois (89.2%, a difference of 0.030%), Delaware (89.2%, a difference of 0.040%), and Immigrants from Indonesia (89.1%, a difference of 0.040%). Similarly, the demographic groups most similar to Bolivians are Venezuelan (89.1%, a difference of 0.020%), American (89.1%, a difference of 0.030%), Spaniard (89.1%, a difference of 0.030%), Potawatomi (89.0%, a difference of 0.040%), and Sudanese (89.1%, a difference of 0.050%).
| Demographics | Rating | Rank | High School Diploma |
| Immigrants | Asia | 59.8 /100 | #165 | Average 89.3% |
| Immigrants | Albania | 59.4 /100 | #166 | Average 89.3% |
| Immigrants | Hong Kong | 58.6 /100 | #167 | Average 89.3% |
| Delaware | 55.8 /100 | #168 | Average 89.2% |
| Iroquois | 55.1 /100 | #169 | Average 89.2% |
| Immigrants | Morocco | 53.3 /100 | #170 | Average 89.2% |
| Spanish | 52.9 /100 | #171 | Average 89.2% |
| Immigrants | Nonimmigrants | 51.8 /100 | #172 | Average 89.2% |
| Immigrants | Indonesia | 50.3 /100 | #173 | Average 89.1% |
| Hmong | 50.0 /100 | #174 | Average 89.1% |
| Immigrants | Western Asia | 49.0 /100 | #175 | Average 89.1% |
| Osage | 48.9 /100 | #176 | Average 89.1% |
| Sudanese | 48.5 /100 | #177 | Average 89.1% |
| Sierra Leoneans | 48.4 /100 | #178 | Average 89.1% |
| Americans | 47.2 /100 | #179 | Average 89.1% |
| Bolivians | 45.2 /100 | #180 | Average 89.1% |
| Venezuelans | 43.6 /100 | #181 | Average 89.1% |
| Spaniards | 43.4 /100 | #182 | Average 89.1% |
| Potawatomi | 42.5 /100 | #183 | Average 89.0% |
| Immigrants | Syria | 39.2 /100 | #184 | Fair 89.0% |
| Ethiopians | 37.0 /100 | #185 | Fair 89.0% |