Immigrants from Northern Europe vs Carpatho Rusyn Associate's Degree
COMPARE
Immigrants from Northern Europe
Carpatho Rusyn
Associate's Degree
Associate's Degree Comparison
Immigrants from Northern Europe
Carpatho Rusyns
53.5%
ASSOCIATE'S DEGREE
100.0/ 100
METRIC RATING
31st/ 347
METRIC RANK
50.6%
ASSOCIATE'S DEGREE
99.3/ 100
METRIC RATING
73rd/ 347
METRIC RANK
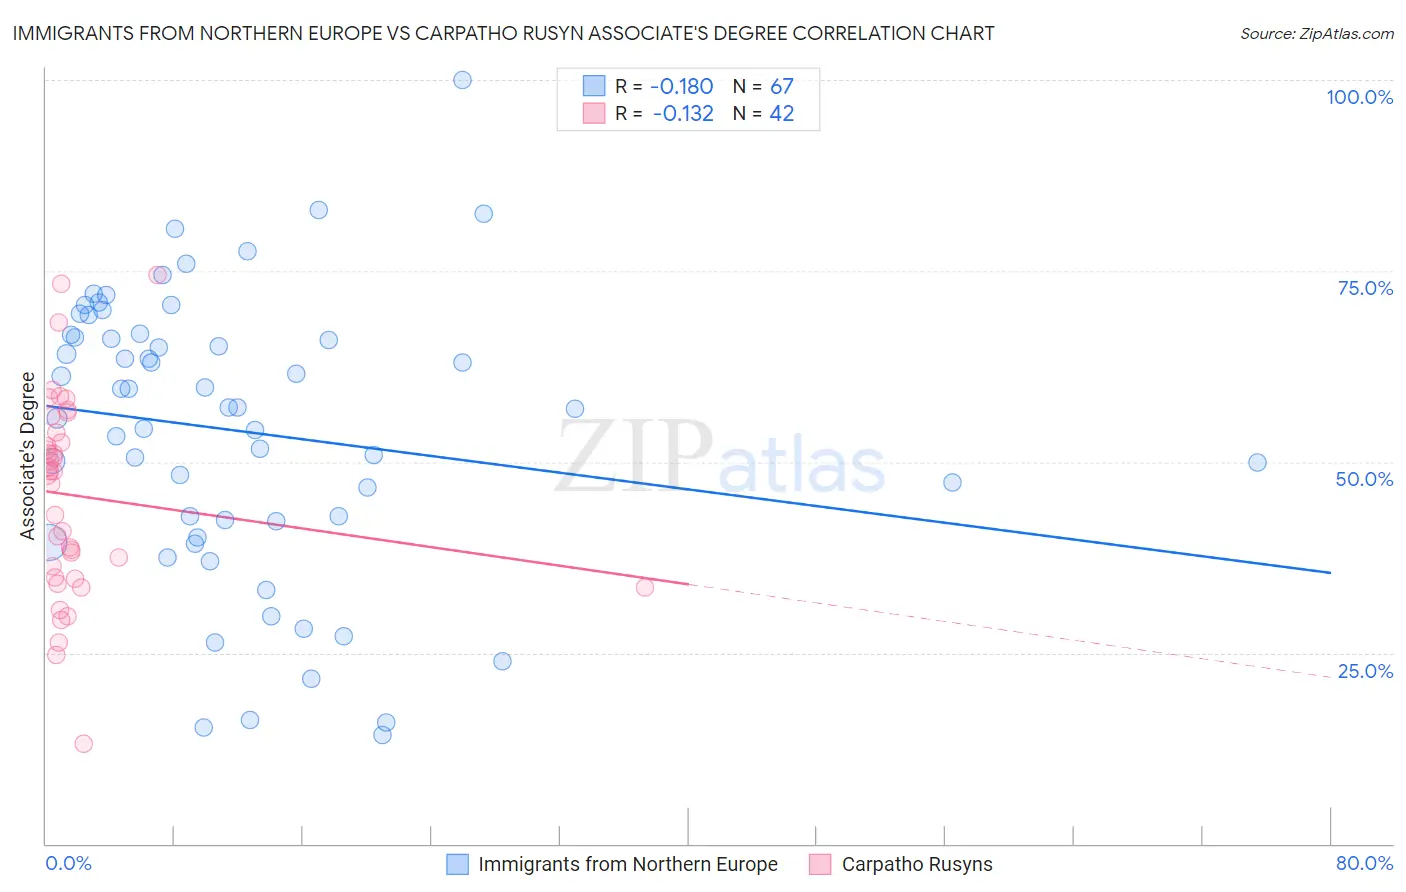
Immigrants from Northern Europe vs Carpatho Rusyn Associate's Degree Correlation Chart
The statistical analysis conducted on geographies consisting of 477,200,235 people shows a poor negative correlation between the proportion of Immigrants from Northern Europe and percentage of population with at least associate's degree education in the United States with a correlation coefficient (R) of -0.180 and weighted average of 53.5%. Similarly, the statistical analysis conducted on geographies consisting of 58,871,690 people shows a poor negative correlation between the proportion of Carpatho Rusyns and percentage of population with at least associate's degree education in the United States with a correlation coefficient (R) of -0.132 and weighted average of 50.6%, a difference of 5.6%.
Associate's Degree Correlation Summary
| Measurement | Immigrants from Northern Europe | Carpatho Rusyn |
| Minimum | 14.3% | 13.2% |
| Maximum | 100.0% | 74.4% |
| Range | 85.7% | 61.2% |
| Mean | 54.0% | 45.6% |
| Median | 57.1% | 48.5% |
| Interquartile 25% (IQ1) | 42.2% | 34.9% |
| Interquartile 75% (IQ3) | 66.6% | 53.9% |
| Interquartile Range (IQR) | 24.4% | 19.0% |
| Standard Deviation (Sample) | 18.6% | 13.2% |
| Standard Deviation (Population) | 18.4% | 13.0% |
Similar Demographics by Associate's Degree
Demographics Similar to Immigrants from Northern Europe by Associate's Degree
In terms of associate's degree, the demographic groups most similar to Immigrants from Northern Europe are Immigrants from Turkey (53.4%, a difference of 0.030%), Israeli (53.4%, a difference of 0.15%), Bulgarian (53.3%, a difference of 0.34%), Immigrants from Sri Lanka (53.7%, a difference of 0.36%), and Russian (53.2%, a difference of 0.40%).
| Demographics | Rating | Rank | Associate's Degree |
| Immigrants | Korea | 100.0 /100 | #24 | Exceptional 54.5% |
| Immigrants | Switzerland | 100.0 /100 | #25 | Exceptional 54.5% |
| Immigrants | Belgium | 100.0 /100 | #26 | Exceptional 54.5% |
| Latvians | 100.0 /100 | #27 | Exceptional 53.9% |
| Turks | 100.0 /100 | #28 | Exceptional 53.9% |
| Immigrants | France | 100.0 /100 | #29 | Exceptional 53.9% |
| Immigrants | Sri Lanka | 100.0 /100 | #30 | Exceptional 53.7% |
| Immigrants | Northern Europe | 100.0 /100 | #31 | Exceptional 53.5% |
| Immigrants | Turkey | 100.0 /100 | #32 | Exceptional 53.4% |
| Israelis | 100.0 /100 | #33 | Exceptional 53.4% |
| Bulgarians | 100.0 /100 | #34 | Exceptional 53.3% |
| Russians | 100.0 /100 | #35 | Exceptional 53.2% |
| Immigrants | Russia | 100.0 /100 | #36 | Exceptional 53.1% |
| Immigrants | Denmark | 100.0 /100 | #37 | Exceptional 53.1% |
| Mongolians | 100.0 /100 | #38 | Exceptional 53.0% |
Demographics Similar to Carpatho Rusyns by Associate's Degree
In terms of associate's degree, the demographic groups most similar to Carpatho Rusyns are Lithuanian (50.6%, a difference of 0.060%), Immigrants from Scotland (50.6%, a difference of 0.10%), Immigrants from Zimbabwe (50.5%, a difference of 0.31%), Immigrants from Lebanon (50.5%, a difference of 0.34%), and Immigrants from Eastern Europe (50.5%, a difference of 0.38%).
| Demographics | Rating | Rank | Associate's Degree |
| Immigrants | Europe | 99.7 /100 | #66 | Exceptional 51.3% |
| Argentineans | 99.6 /100 | #67 | Exceptional 51.2% |
| Immigrants | Indonesia | 99.5 /100 | #68 | Exceptional 51.0% |
| Egyptians | 99.5 /100 | #69 | Exceptional 50.9% |
| Immigrants | Argentina | 99.5 /100 | #70 | Exceptional 50.9% |
| Immigrants | Romania | 99.5 /100 | #71 | Exceptional 50.9% |
| Immigrants | Pakistan | 99.5 /100 | #72 | Exceptional 50.9% |
| Carpatho Rusyns | 99.3 /100 | #73 | Exceptional 50.6% |
| Lithuanians | 99.3 /100 | #74 | Exceptional 50.6% |
| Immigrants | Scotland | 99.3 /100 | #75 | Exceptional 50.6% |
| Immigrants | Zimbabwe | 99.2 /100 | #76 | Exceptional 50.5% |
| Immigrants | Lebanon | 99.1 /100 | #77 | Exceptional 50.5% |
| Immigrants | Eastern Europe | 99.1 /100 | #78 | Exceptional 50.5% |
| Ethiopians | 99.1 /100 | #79 | Exceptional 50.4% |
| Armenians | 99.1 /100 | #80 | Exceptional 50.4% |