Immigrants from Northern Europe vs Guyanese Associate's Degree
COMPARE
Immigrants from Northern Europe
Guyanese
Associate's Degree
Associate's Degree Comparison
Immigrants from Northern Europe
Guyanese
53.5%
ASSOCIATE'S DEGREE
100.0/ 100
METRIC RATING
31st/ 347
METRIC RANK
42.3%
ASSOCIATE'S DEGREE
1.0/ 100
METRIC RATING
243rd/ 347
METRIC RANK
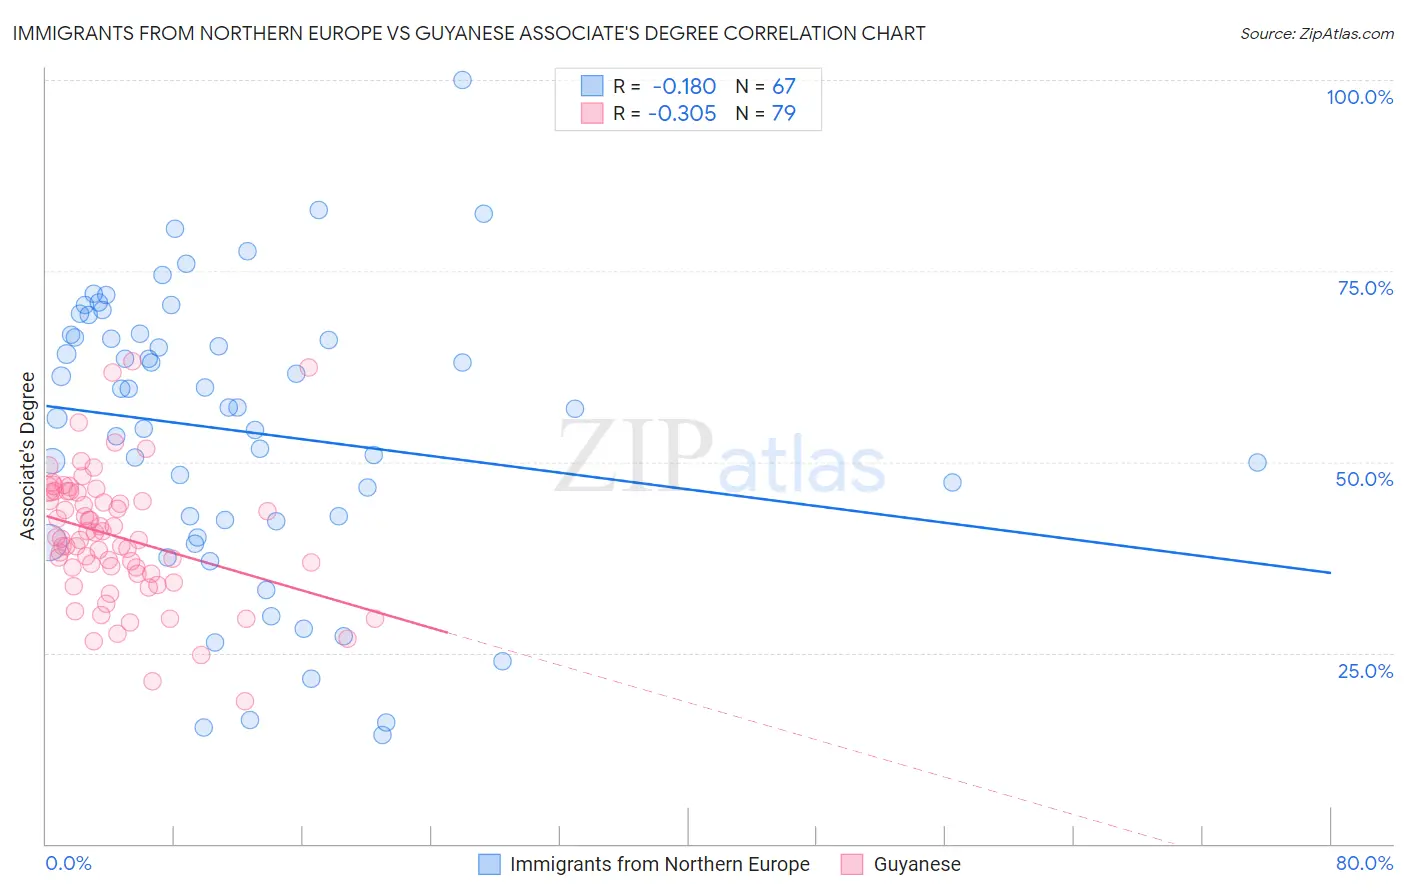
Immigrants from Northern Europe vs Guyanese Associate's Degree Correlation Chart
The statistical analysis conducted on geographies consisting of 477,200,235 people shows a poor negative correlation between the proportion of Immigrants from Northern Europe and percentage of population with at least associate's degree education in the United States with a correlation coefficient (R) of -0.180 and weighted average of 53.5%. Similarly, the statistical analysis conducted on geographies consisting of 176,923,835 people shows a mild negative correlation between the proportion of Guyanese and percentage of population with at least associate's degree education in the United States with a correlation coefficient (R) of -0.305 and weighted average of 42.3%, a difference of 26.3%.
Associate's Degree Correlation Summary
| Measurement | Immigrants from Northern Europe | Guyanese |
| Minimum | 14.3% | 18.6% |
| Maximum | 100.0% | 63.1% |
| Range | 85.7% | 44.5% |
| Mean | 54.0% | 40.2% |
| Median | 57.1% | 39.9% |
| Interquartile 25% (IQ1) | 42.2% | 35.4% |
| Interquartile 75% (IQ3) | 66.6% | 46.0% |
| Interquartile Range (IQR) | 24.4% | 10.6% |
| Standard Deviation (Sample) | 18.6% | 8.5% |
| Standard Deviation (Population) | 18.4% | 8.5% |
Similar Demographics by Associate's Degree
Demographics Similar to Immigrants from Northern Europe by Associate's Degree
In terms of associate's degree, the demographic groups most similar to Immigrants from Northern Europe are Immigrants from Turkey (53.4%, a difference of 0.030%), Israeli (53.4%, a difference of 0.15%), Bulgarian (53.3%, a difference of 0.34%), Immigrants from Sri Lanka (53.7%, a difference of 0.36%), and Russian (53.2%, a difference of 0.40%).
| Demographics | Rating | Rank | Associate's Degree |
| Immigrants | Korea | 100.0 /100 | #24 | Exceptional 54.5% |
| Immigrants | Switzerland | 100.0 /100 | #25 | Exceptional 54.5% |
| Immigrants | Belgium | 100.0 /100 | #26 | Exceptional 54.5% |
| Latvians | 100.0 /100 | #27 | Exceptional 53.9% |
| Turks | 100.0 /100 | #28 | Exceptional 53.9% |
| Immigrants | France | 100.0 /100 | #29 | Exceptional 53.9% |
| Immigrants | Sri Lanka | 100.0 /100 | #30 | Exceptional 53.7% |
| Immigrants | Northern Europe | 100.0 /100 | #31 | Exceptional 53.5% |
| Immigrants | Turkey | 100.0 /100 | #32 | Exceptional 53.4% |
| Israelis | 100.0 /100 | #33 | Exceptional 53.4% |
| Bulgarians | 100.0 /100 | #34 | Exceptional 53.3% |
| Russians | 100.0 /100 | #35 | Exceptional 53.2% |
| Immigrants | Russia | 100.0 /100 | #36 | Exceptional 53.1% |
| Immigrants | Denmark | 100.0 /100 | #37 | Exceptional 53.1% |
| Mongolians | 100.0 /100 | #38 | Exceptional 53.0% |
Demographics Similar to Guyanese by Associate's Degree
In terms of associate's degree, the demographic groups most similar to Guyanese are Immigrants from West Indies (42.4%, a difference of 0.11%), British West Indian (42.4%, a difference of 0.12%), Immigrants from Liberia (42.3%, a difference of 0.14%), Immigrants from Cambodia (42.3%, a difference of 0.16%), and Delaware (42.3%, a difference of 0.19%).
| Demographics | Rating | Rank | Associate's Degree |
| Immigrants | St. Vincent and the Grenadines | 1.9 /100 | #236 | Tragic 42.9% |
| Immigrants | Nonimmigrants | 1.9 /100 | #237 | Tragic 42.9% |
| Iroquois | 1.7 /100 | #238 | Tragic 42.8% |
| Immigrants | Grenada | 1.3 /100 | #239 | Tragic 42.6% |
| Cree | 1.2 /100 | #240 | Tragic 42.5% |
| British West Indians | 1.0 /100 | #241 | Tragic 42.4% |
| Immigrants | West Indies | 1.0 /100 | #242 | Tragic 42.4% |
| Guyanese | 1.0 /100 | #243 | Tragic 42.3% |
| Immigrants | Liberia | 0.9 /100 | #244 | Tragic 42.3% |
| Immigrants | Cambodia | 0.9 /100 | #245 | Tragic 42.3% |
| Delaware | 0.9 /100 | #246 | Tragic 42.3% |
| Immigrants | Fiji | 0.8 /100 | #247 | Tragic 42.2% |
| Immigrants | Ecuador | 0.8 /100 | #248 | Tragic 42.2% |
| Jamaicans | 0.7 /100 | #249 | Tragic 42.1% |
| U.S. Virgin Islanders | 0.7 /100 | #250 | Tragic 42.1% |