Immigrants from Northern Europe vs Scotch-Irish Associate's Degree
COMPARE
Immigrants from Northern Europe
Scotch-Irish
Associate's Degree
Associate's Degree Comparison
Immigrants from Northern Europe
Scotch-Irish
53.5%
ASSOCIATE'S DEGREE
100.0/ 100
METRIC RATING
31st/ 347
METRIC RANK
45.3%
ASSOCIATE'S DEGREE
22.3/ 100
METRIC RATING
197th/ 347
METRIC RANK
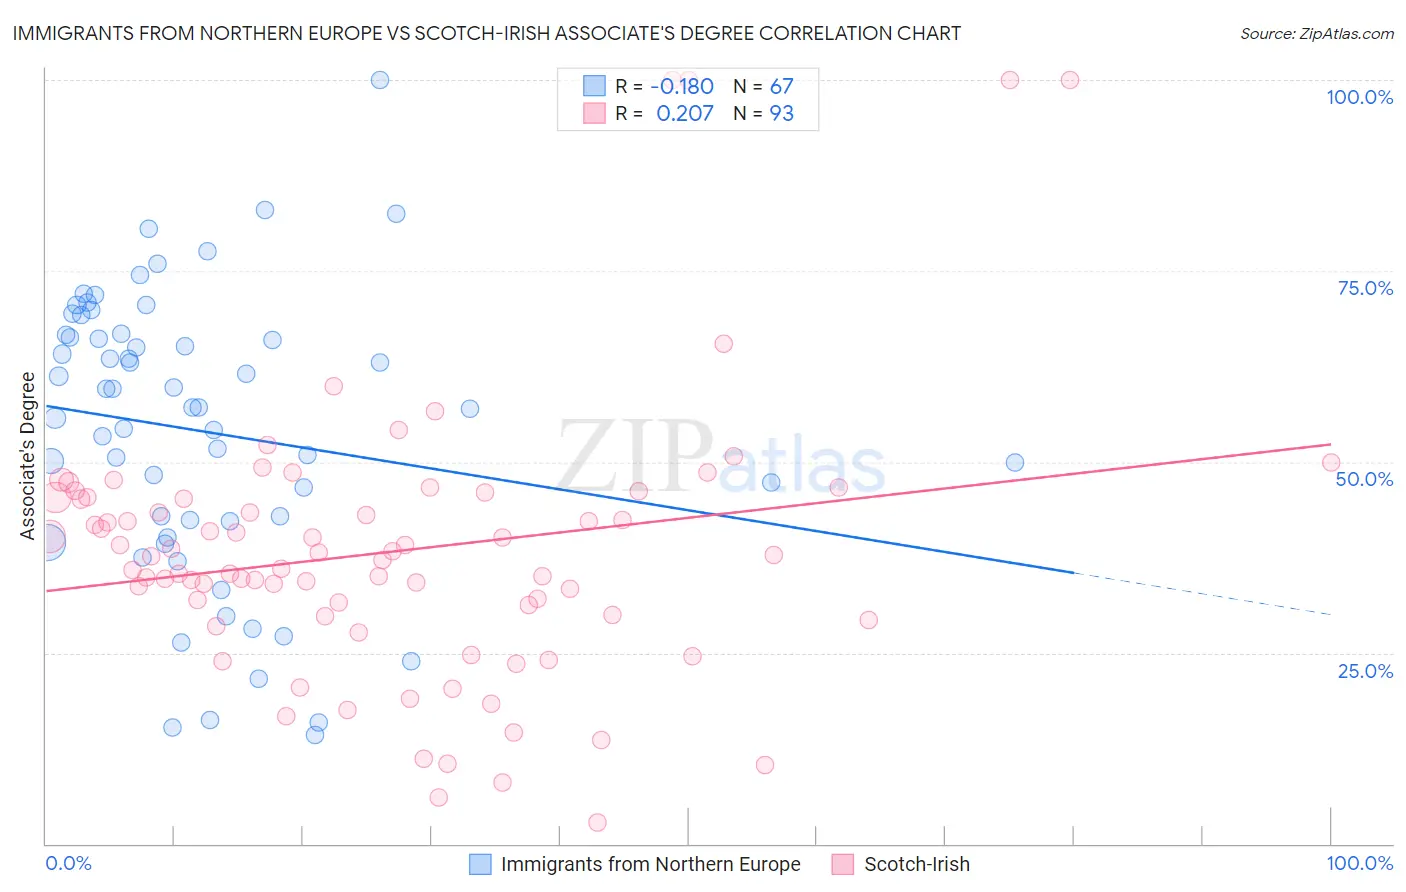
Immigrants from Northern Europe vs Scotch-Irish Associate's Degree Correlation Chart
The statistical analysis conducted on geographies consisting of 477,200,235 people shows a poor negative correlation between the proportion of Immigrants from Northern Europe and percentage of population with at least associate's degree education in the United States with a correlation coefficient (R) of -0.180 and weighted average of 53.5%. Similarly, the statistical analysis conducted on geographies consisting of 548,737,246 people shows a weak positive correlation between the proportion of Scotch-Irish and percentage of population with at least associate's degree education in the United States with a correlation coefficient (R) of 0.207 and weighted average of 45.3%, a difference of 18.1%.
Associate's Degree Correlation Summary
| Measurement | Immigrants from Northern Europe | Scotch-Irish |
| Minimum | 14.3% | 2.9% |
| Maximum | 100.0% | 100.0% |
| Range | 85.7% | 97.1% |
| Mean | 54.0% | 38.2% |
| Median | 57.1% | 37.7% |
| Interquartile 25% (IQ1) | 42.2% | 29.9% |
| Interquartile 75% (IQ3) | 66.6% | 45.3% |
| Interquartile Range (IQR) | 24.4% | 15.5% |
| Standard Deviation (Sample) | 18.6% | 17.9% |
| Standard Deviation (Population) | 18.4% | 17.8% |
Similar Demographics by Associate's Degree
Demographics Similar to Immigrants from Northern Europe by Associate's Degree
In terms of associate's degree, the demographic groups most similar to Immigrants from Northern Europe are Immigrants from Turkey (53.4%, a difference of 0.030%), Israeli (53.4%, a difference of 0.15%), Bulgarian (53.3%, a difference of 0.34%), Immigrants from Sri Lanka (53.7%, a difference of 0.36%), and Russian (53.2%, a difference of 0.40%).
| Demographics | Rating | Rank | Associate's Degree |
| Immigrants | Korea | 100.0 /100 | #24 | Exceptional 54.5% |
| Immigrants | Switzerland | 100.0 /100 | #25 | Exceptional 54.5% |
| Immigrants | Belgium | 100.0 /100 | #26 | Exceptional 54.5% |
| Latvians | 100.0 /100 | #27 | Exceptional 53.9% |
| Turks | 100.0 /100 | #28 | Exceptional 53.9% |
| Immigrants | France | 100.0 /100 | #29 | Exceptional 53.9% |
| Immigrants | Sri Lanka | 100.0 /100 | #30 | Exceptional 53.7% |
| Immigrants | Northern Europe | 100.0 /100 | #31 | Exceptional 53.5% |
| Immigrants | Turkey | 100.0 /100 | #32 | Exceptional 53.4% |
| Israelis | 100.0 /100 | #33 | Exceptional 53.4% |
| Bulgarians | 100.0 /100 | #34 | Exceptional 53.3% |
| Russians | 100.0 /100 | #35 | Exceptional 53.2% |
| Immigrants | Russia | 100.0 /100 | #36 | Exceptional 53.1% |
| Immigrants | Denmark | 100.0 /100 | #37 | Exceptional 53.1% |
| Mongolians | 100.0 /100 | #38 | Exceptional 53.0% |
Demographics Similar to Scotch-Irish by Associate's Degree
In terms of associate's degree, the demographic groups most similar to Scotch-Irish are Immigrants from Bangladesh (45.2%, a difference of 0.10%), Immigrants from Senegal (45.2%, a difference of 0.12%), Senegalese (45.2%, a difference of 0.13%), Immigrants from Vietnam (45.2%, a difference of 0.16%), and Spaniard (45.2%, a difference of 0.21%).
| Demographics | Rating | Rank | Associate's Degree |
| Vietnamese | 34.0 /100 | #190 | Fair 45.8% |
| Koreans | 33.8 /100 | #191 | Fair 45.8% |
| Celtics | 33.3 /100 | #192 | Fair 45.8% |
| Immigrants | Cameroon | 31.0 /100 | #193 | Fair 45.7% |
| Immigrants | Peru | 27.6 /100 | #194 | Fair 45.5% |
| Germans | 26.5 /100 | #195 | Fair 45.5% |
| French | 25.6 /100 | #196 | Fair 45.4% |
| Scotch-Irish | 22.3 /100 | #197 | Fair 45.3% |
| Immigrants | Bangladesh | 21.3 /100 | #198 | Fair 45.2% |
| Immigrants | Senegal | 21.2 /100 | #199 | Fair 45.2% |
| Senegalese | 21.1 /100 | #200 | Fair 45.2% |
| Immigrants | Vietnam | 20.8 /100 | #201 | Fair 45.2% |
| Spaniards | 20.4 /100 | #202 | Fair 45.2% |
| Immigrants | South Eastern Asia | 20.2 /100 | #203 | Fair 45.2% |
| Nigerians | 19.1 /100 | #204 | Poor 45.1% |