Immigrants from Northern Africa vs Ukrainian Bachelor's Degree
COMPARE
Immigrants from Northern Africa
Ukrainian
Bachelor's Degree
Bachelor's Degree Comparison
Immigrants from Northern Africa
Ukrainians
41.9%
BACHELOR'S DEGREE
98.9/ 100
METRIC RATING
91st/ 347
METRIC RANK
40.9%
BACHELOR'S DEGREE
96.6/ 100
METRIC RATING
108th/ 347
METRIC RANK
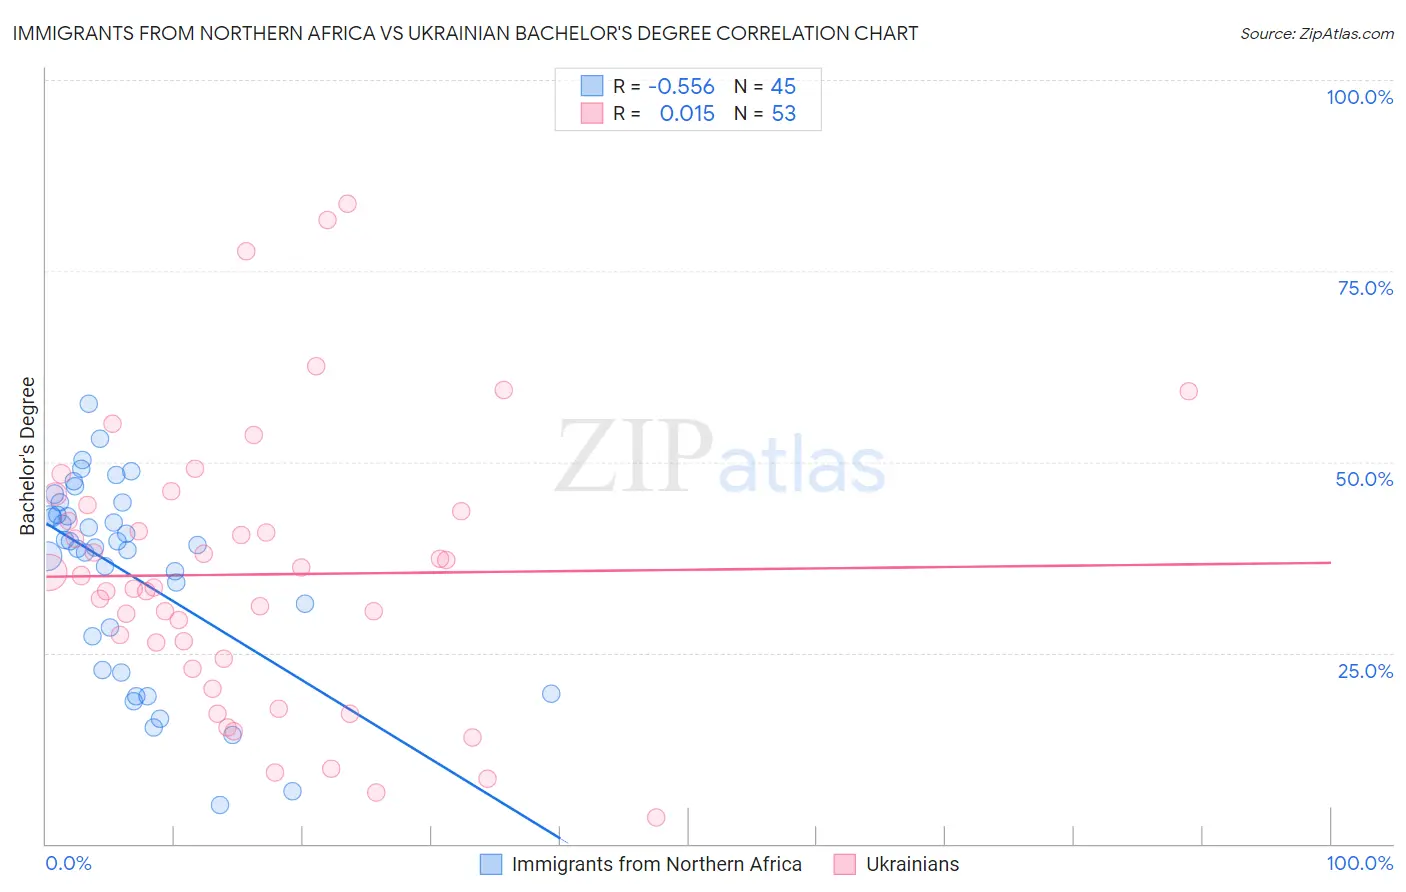
Immigrants from Northern Africa vs Ukrainian Bachelor's Degree Correlation Chart
The statistical analysis conducted on geographies consisting of 321,192,912 people shows a substantial negative correlation between the proportion of Immigrants from Northern Africa and percentage of population with at least bachelor's degree education in the United States with a correlation coefficient (R) of -0.556 and weighted average of 41.9%. Similarly, the statistical analysis conducted on geographies consisting of 448,644,466 people shows no correlation between the proportion of Ukrainians and percentage of population with at least bachelor's degree education in the United States with a correlation coefficient (R) of 0.015 and weighted average of 40.9%, a difference of 2.5%.
Bachelor's Degree Correlation Summary
| Measurement | Immigrants from Northern Africa | Ukrainian |
| Minimum | 5.0% | 3.4% |
| Maximum | 57.6% | 83.8% |
| Range | 52.6% | 80.3% |
| Mean | 35.5% | 35.3% |
| Median | 39.1% | 33.6% |
| Interquartile 25% (IQ1) | 24.9% | 23.6% |
| Interquartile 75% (IQ3) | 43.8% | 43.9% |
| Interquartile Range (IQR) | 18.9% | 20.3% |
| Standard Deviation (Sample) | 12.7% | 18.0% |
| Standard Deviation (Population) | 12.5% | 17.8% |
Demographics Similar to Immigrants from Northern Africa and Ukrainians by Bachelor's Degree
In terms of bachelor's degree, the demographic groups most similar to Immigrants from Northern Africa are Maltese (41.9%, a difference of 0.070%), Laotian (42.0%, a difference of 0.10%), Greek (42.0%, a difference of 0.22%), Immigrants from Canada (41.7%, a difference of 0.53%), and Immigrants from Nepal (41.7%, a difference of 0.55%). Similarly, the demographic groups most similar to Ukrainians are Arab (40.9%, a difference of 0.020%), Northern European (41.0%, a difference of 0.14%), Alsatian (41.0%, a difference of 0.31%), Syrian (41.1%, a difference of 0.57%), and Jordanian (41.2%, a difference of 0.60%).
| Demographics | Rating | Rank | Bachelor's Degree |
| Greeks | 99.0 /100 | #89 | Exceptional 42.0% |
| Laotians | 98.9 /100 | #90 | Exceptional 42.0% |
| Immigrants | Northern Africa | 98.9 /100 | #91 | Exceptional 41.9% |
| Maltese | 98.8 /100 | #92 | Exceptional 41.9% |
| Immigrants | Canada | 98.6 /100 | #93 | Exceptional 41.7% |
| Immigrants | Nepal | 98.6 /100 | #94 | Exceptional 41.7% |
| Immigrants | North America | 98.5 /100 | #95 | Exceptional 41.7% |
| Immigrants | Moldova | 98.4 /100 | #96 | Exceptional 41.6% |
| Romanians | 98.4 /100 | #97 | Exceptional 41.6% |
| Immigrants | Ukraine | 98.3 /100 | #98 | Exceptional 41.5% |
| Immigrants | England | 98.1 /100 | #99 | Exceptional 41.4% |
| Macedonians | 98.1 /100 | #100 | Exceptional 41.4% |
| Immigrants | Morocco | 98.0 /100 | #101 | Exceptional 41.4% |
| Immigrants | Italy | 97.8 /100 | #102 | Exceptional 41.3% |
| Chileans | 97.5 /100 | #103 | Exceptional 41.2% |
| Jordanians | 97.4 /100 | #104 | Exceptional 41.2% |
| Syrians | 97.4 /100 | #105 | Exceptional 41.1% |
| Alsatians | 97.0 /100 | #106 | Exceptional 41.0% |
| Northern Europeans | 96.8 /100 | #107 | Exceptional 41.0% |
| Ukrainians | 96.6 /100 | #108 | Exceptional 40.9% |
| Arabs | 96.6 /100 | #109 | Exceptional 40.9% |