Immigrants from North Macedonia vs Bahamian Associate's Degree
COMPARE
Immigrants from North Macedonia
Bahamian
Associate's Degree
Associate's Degree Comparison
Immigrants from North Macedonia
Bahamians
47.4%
ASSOCIATE'S DEGREE
76.0/ 100
METRIC RATING
151st/ 347
METRIC RANK
41.5%
ASSOCIATE'S DEGREE
0.4/ 100
METRIC RATING
262nd/ 347
METRIC RANK
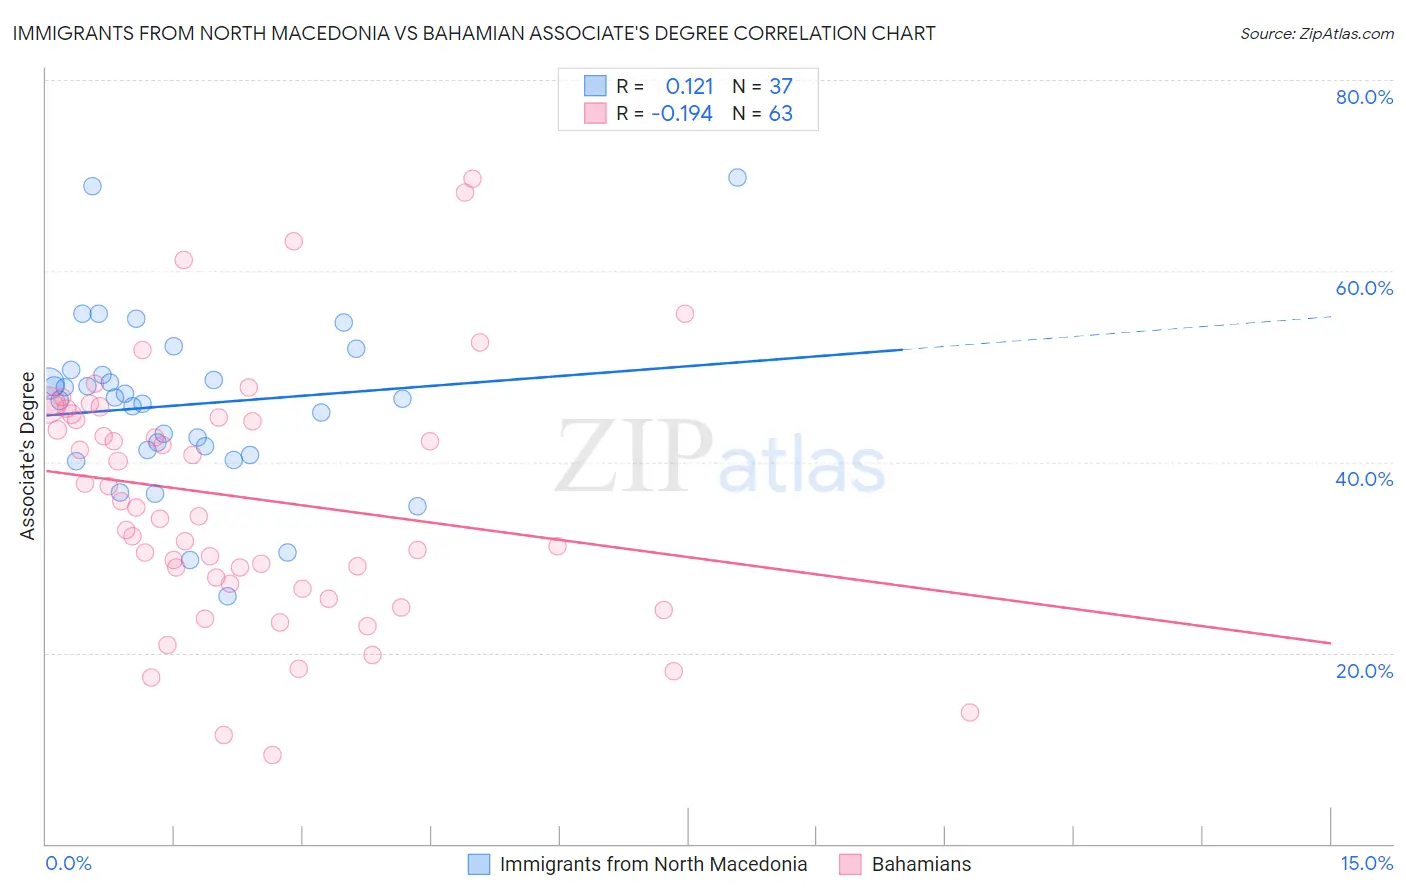
Immigrants from North Macedonia vs Bahamian Associate's Degree Correlation Chart
The statistical analysis conducted on geographies consisting of 74,317,045 people shows a poor positive correlation between the proportion of Immigrants from North Macedonia and percentage of population with at least associate's degree education in the United States with a correlation coefficient (R) of 0.121 and weighted average of 47.4%. Similarly, the statistical analysis conducted on geographies consisting of 112,704,799 people shows a poor negative correlation between the proportion of Bahamians and percentage of population with at least associate's degree education in the United States with a correlation coefficient (R) of -0.194 and weighted average of 41.5%, a difference of 14.2%.
Associate's Degree Correlation Summary
| Measurement | Immigrants from North Macedonia | Bahamian |
| Minimum | 25.9% | 9.3% |
| Maximum | 69.8% | 69.7% |
| Range | 43.9% | 60.4% |
| Mean | 46.0% | 36.3% |
| Median | 46.6% | 35.2% |
| Interquartile 25% (IQ1) | 41.0% | 27.3% |
| Interquartile 75% (IQ3) | 49.3% | 45.0% |
| Interquartile Range (IQR) | 8.3% | 17.7% |
| Standard Deviation (Sample) | 9.0% | 13.1% |
| Standard Deviation (Population) | 8.9% | 13.0% |
Similar Demographics by Associate's Degree
Demographics Similar to Immigrants from North Macedonia by Associate's Degree
In terms of associate's degree, the demographic groups most similar to Immigrants from North Macedonia are Iraqi (47.4%, a difference of 0.020%), Immigrants from Armenia (47.4%, a difference of 0.060%), South American Indian (47.4%, a difference of 0.070%), Danish (47.4%, a difference of 0.14%), and Immigrants from Afghanistan (47.3%, a difference of 0.17%).
| Demographics | Rating | Rank | Associate's Degree |
| Slavs | 80.5 /100 | #144 | Excellent 47.6% |
| Canadians | 79.0 /100 | #145 | Good 47.5% |
| Immigrants | Sudan | 77.9 /100 | #146 | Good 47.4% |
| Danes | 77.3 /100 | #147 | Good 47.4% |
| South American Indians | 76.7 /100 | #148 | Good 47.4% |
| Immigrants | Armenia | 76.6 /100 | #149 | Good 47.4% |
| Iraqis | 76.2 /100 | #150 | Good 47.4% |
| Immigrants | North Macedonia | 76.0 /100 | #151 | Good 47.4% |
| Immigrants | Afghanistan | 74.3 /100 | #152 | Good 47.3% |
| Czechs | 72.2 /100 | #153 | Good 47.2% |
| Immigrants | Kenya | 72.1 /100 | #154 | Good 47.2% |
| Kenyans | 70.6 /100 | #155 | Good 47.1% |
| South Americans | 70.5 /100 | #156 | Good 47.1% |
| Sudanese | 70.3 /100 | #157 | Good 47.1% |
| Immigrants | Germany | 69.7 /100 | #158 | Good 47.1% |
Demographics Similar to Bahamians by Associate's Degree
In terms of associate's degree, the demographic groups most similar to Bahamians are Immigrants from Jamaica (41.5%, a difference of 0.020%), Osage (41.5%, a difference of 0.030%), Nicaraguan (41.5%, a difference of 0.090%), Marshallese (41.6%, a difference of 0.22%), and Malaysian (41.6%, a difference of 0.41%).
| Demographics | Rating | Rank | Associate's Degree |
| Immigrants | Guyana | 0.5 /100 | #255 | Tragic 41.8% |
| Immigrants | Congo | 0.5 /100 | #256 | Tragic 41.8% |
| Spanish Americans | 0.5 /100 | #257 | Tragic 41.8% |
| Japanese | 0.5 /100 | #258 | Tragic 41.7% |
| Malaysians | 0.4 /100 | #259 | Tragic 41.6% |
| Marshallese | 0.4 /100 | #260 | Tragic 41.6% |
| Nicaraguans | 0.4 /100 | #261 | Tragic 41.5% |
| Bahamians | 0.4 /100 | #262 | Tragic 41.5% |
| Immigrants | Jamaica | 0.3 /100 | #263 | Tragic 41.5% |
| Osage | 0.3 /100 | #264 | Tragic 41.5% |
| Africans | 0.2 /100 | #265 | Tragic 41.1% |
| Samoans | 0.2 /100 | #266 | Tragic 41.1% |
| Hawaiians | 0.2 /100 | #267 | Tragic 40.9% |
| Central American Indians | 0.2 /100 | #268 | Tragic 40.8% |
| Americans | 0.2 /100 | #269 | Tragic 40.8% |